Fig. 17.
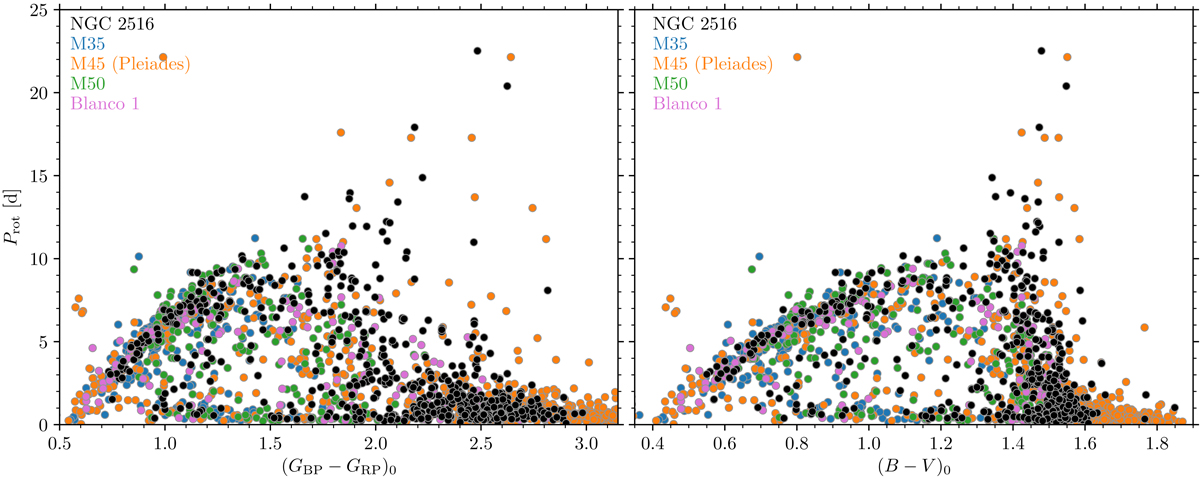
Representative ZAMS rotation period distribution shown in combined colour-period diagrams of all considered open clusters in both Gaia (GBP − GRP)0 (left) and (B − V)0 colours (right). The fast and slow sequences, including the extended slow rotator sequence are evident, as is the less-densely occupied region between the sequences. The display colours of the individual open clusters are the same as in Figs. 16 and B.1, with the latter providing separate comparison panels for the individual clusters in B − V colour. See Fig. B.2 for an approximate way to represent this distribution in a colour-independent way using elementary functions of the convective turnover timescale.
Current usage metrics show cumulative count of Article Views (full-text article views including HTML views, PDF and ePub downloads, according to the available data) and Abstracts Views on Vision4Press platform.
Data correspond to usage on the plateform after 2015. The current usage metrics is available 48-96 hours after online publication and is updated daily on week days.
Initial download of the metrics may take a while.