Fig. 15.
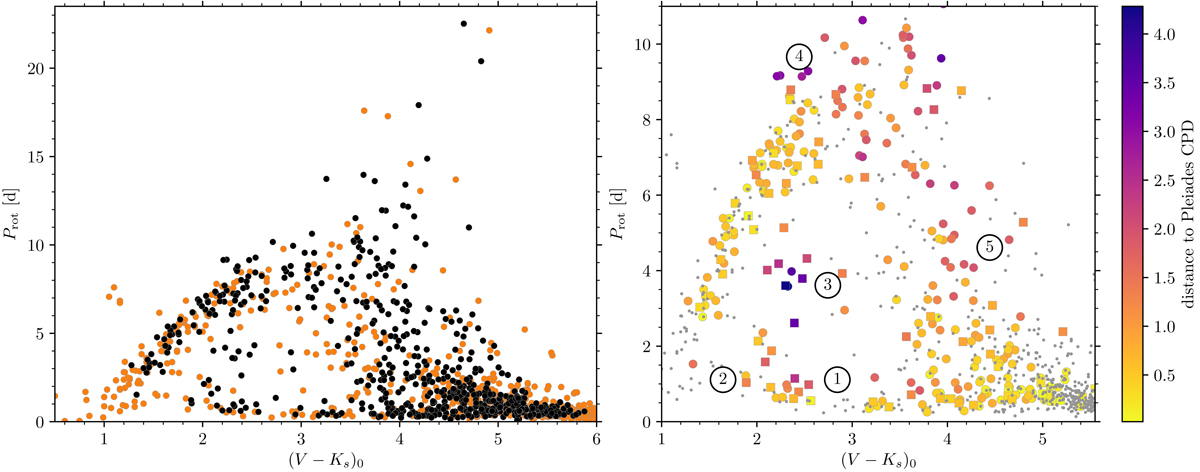
Left: colour-period diagram for both NGC 2516 (black, union of data from this work and I07) and the Pleiades (orange). The similarity of the two distributions across all sampled regions of the colour-period diagram is noticeable. Right: distance of a given NGC 2516 star (coloured symbols) in the CPD to the corresponding Pleiades star. Distance is measured in standard deviations (see text), and colours range from yellow (very near) to deep purple (most distant; see scale). The fast- and slow sequences, representing the edges of the rotation distributions, are mostly very close (yellow), while the intermediate and sparsely populated regions of the CPD are quite distant (deep purple). The Pleiades data are displayed with grey dots in the background. Circular symbols indicate single stars, while square symbols indicate possible binaries. The encircled numerals from 1 to 5 indicate specific regions discussed in detail in the text. (This panel has a restricted period axis range compared to the left panel).
Current usage metrics show cumulative count of Article Views (full-text article views including HTML views, PDF and ePub downloads, according to the available data) and Abstracts Views on Vision4Press platform.
Data correspond to usage on the plateform after 2015. The current usage metrics is available 48-96 hours after online publication and is updated daily on week days.
Initial download of the metrics may take a while.