Fig. 14.
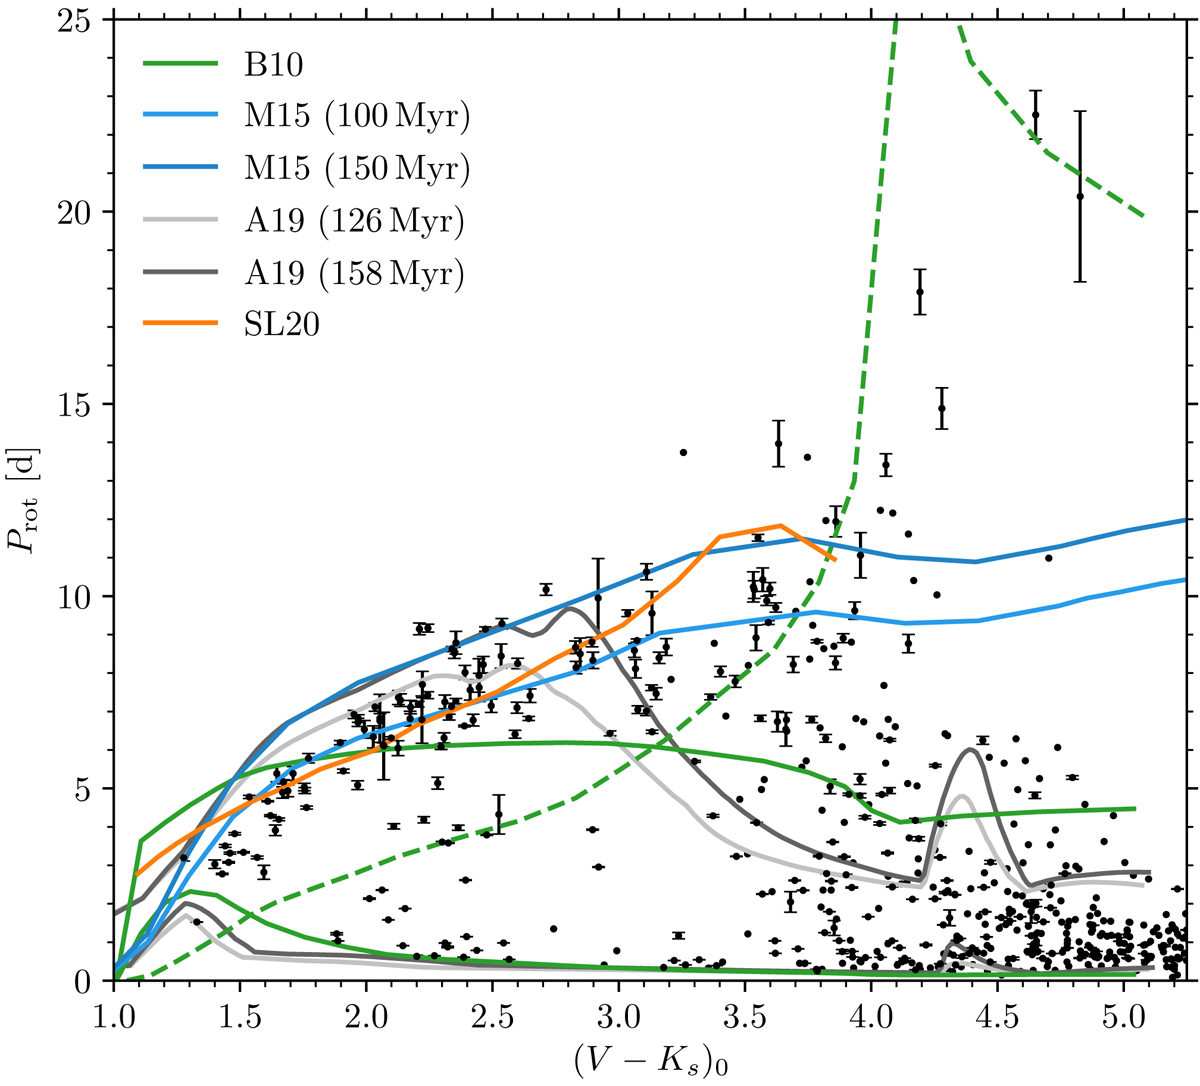
Colour-period diagram for NGC 2516 comparing multiple rotational isochrones (chronological by date of publication top to bottom in the legend). Green curves show the upper and lower boundaries of models from Barnes (2010) (B10) with corresponding initial periods of 3.4 d and 0.12 d respectively. The dashed line indicates the transition (Ro = 0.06) between fast- and slow rotation in the B10 model. The blue curves show the asymptotic spin rate from Matt et al. (2015) (M15) for 150 Myr (upper blue) and 100 Myr (lower blue). The grey curves show the models of Amard et al. (2019) (A19) for 158 Myr and 126 Myr, each for both the slow and fast rotators. The orange curve shows the two-zone model of Spada & Lanzafame (2020) (SL20) for 150 Myr. (See the text for a detailed comparison of each model with the data).
Current usage metrics show cumulative count of Article Views (full-text article views including HTML views, PDF and ePub downloads, according to the available data) and Abstracts Views on Vision4Press platform.
Data correspond to usage on the plateform after 2015. The current usage metrics is available 48-96 hours after online publication and is updated daily on week days.
Initial download of the metrics may take a while.