Fig. 13.
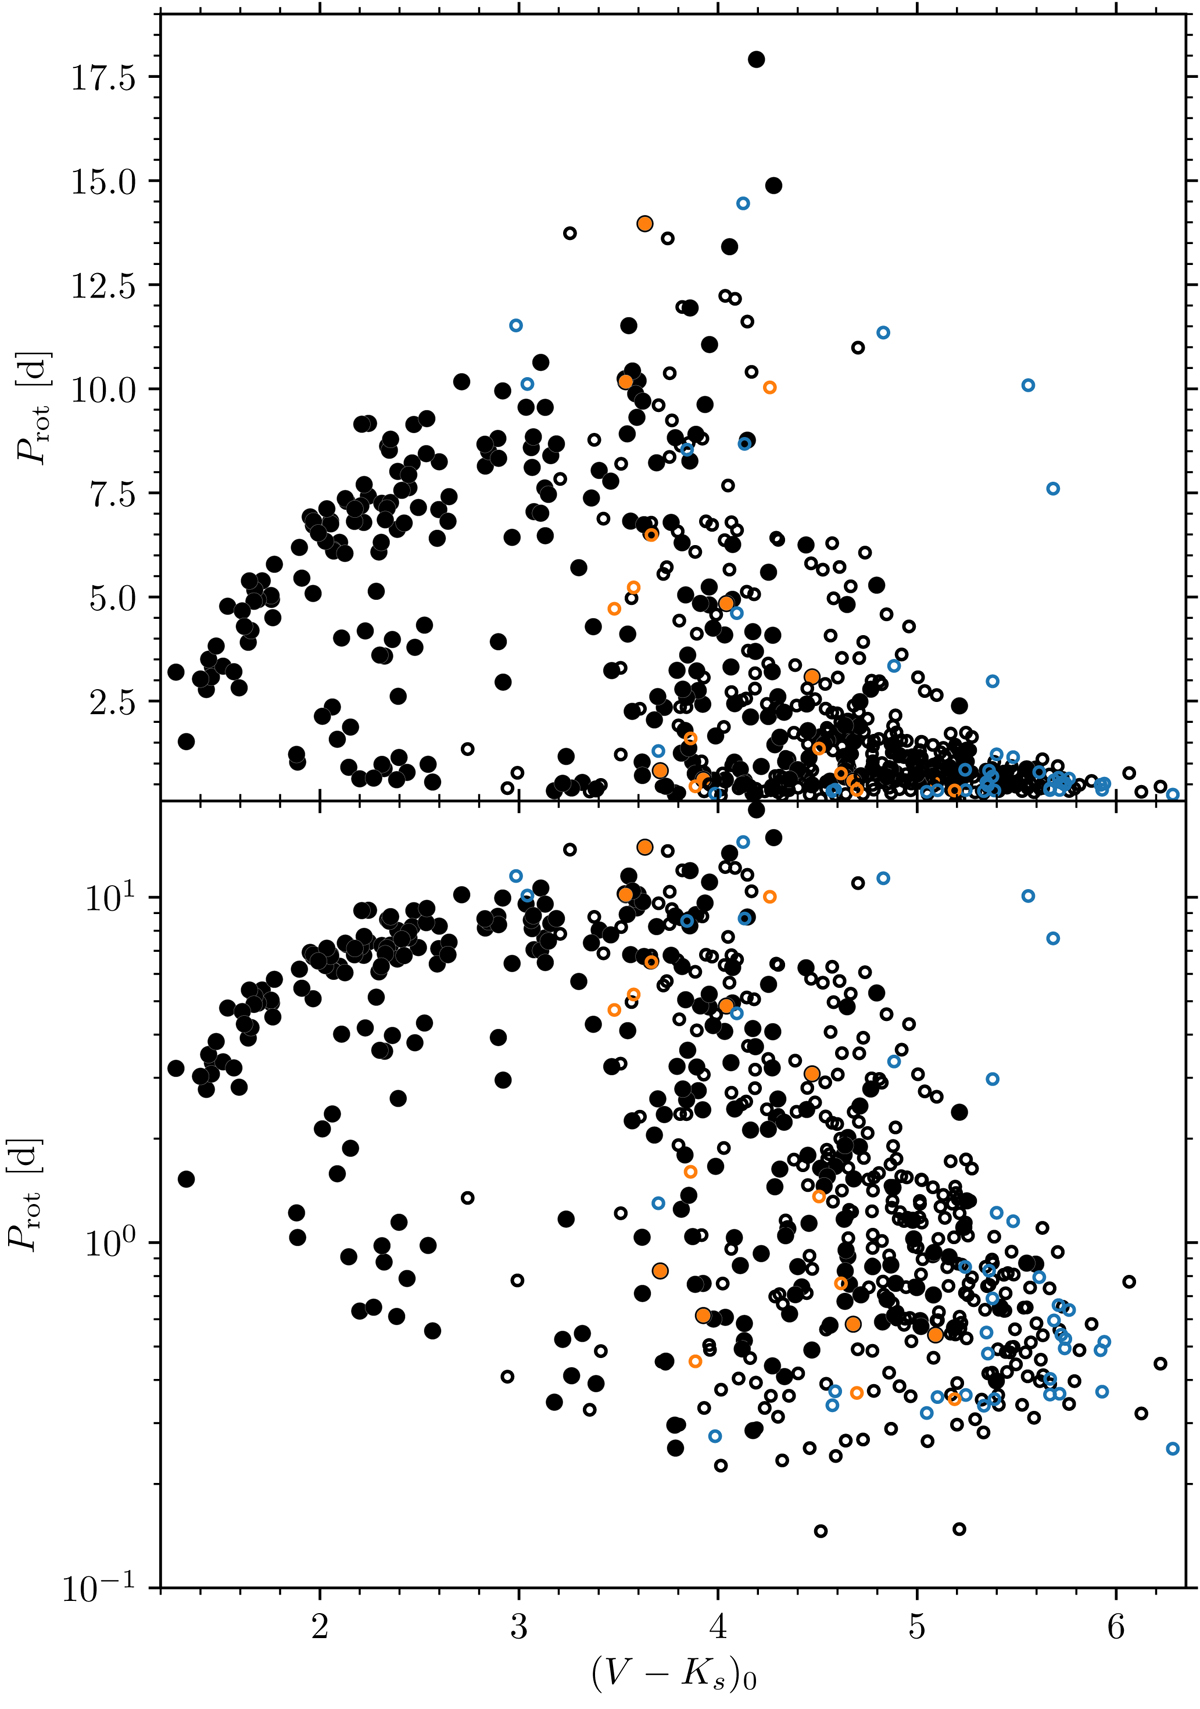
Colour-period diagram for NGC 2516 with our data (solid) and the data from I07 (open) on both linear and logarithmic scales. Periods in disagreement between the two data sets are marked in orange (with solid circles for this work, open circles for I07). Blue symbols indicate non-members from I07 (subsequently suppressed), identified as such by us using the improved astrometry and new radial velocity measurements.
Current usage metrics show cumulative count of Article Views (full-text article views including HTML views, PDF and ePub downloads, according to the available data) and Abstracts Views on Vision4Press platform.
Data correspond to usage on the plateform after 2015. The current usage metrics is available 48-96 hours after online publication and is updated daily on week days.
Initial download of the metrics may take a while.