Free Access
Fig. 11.
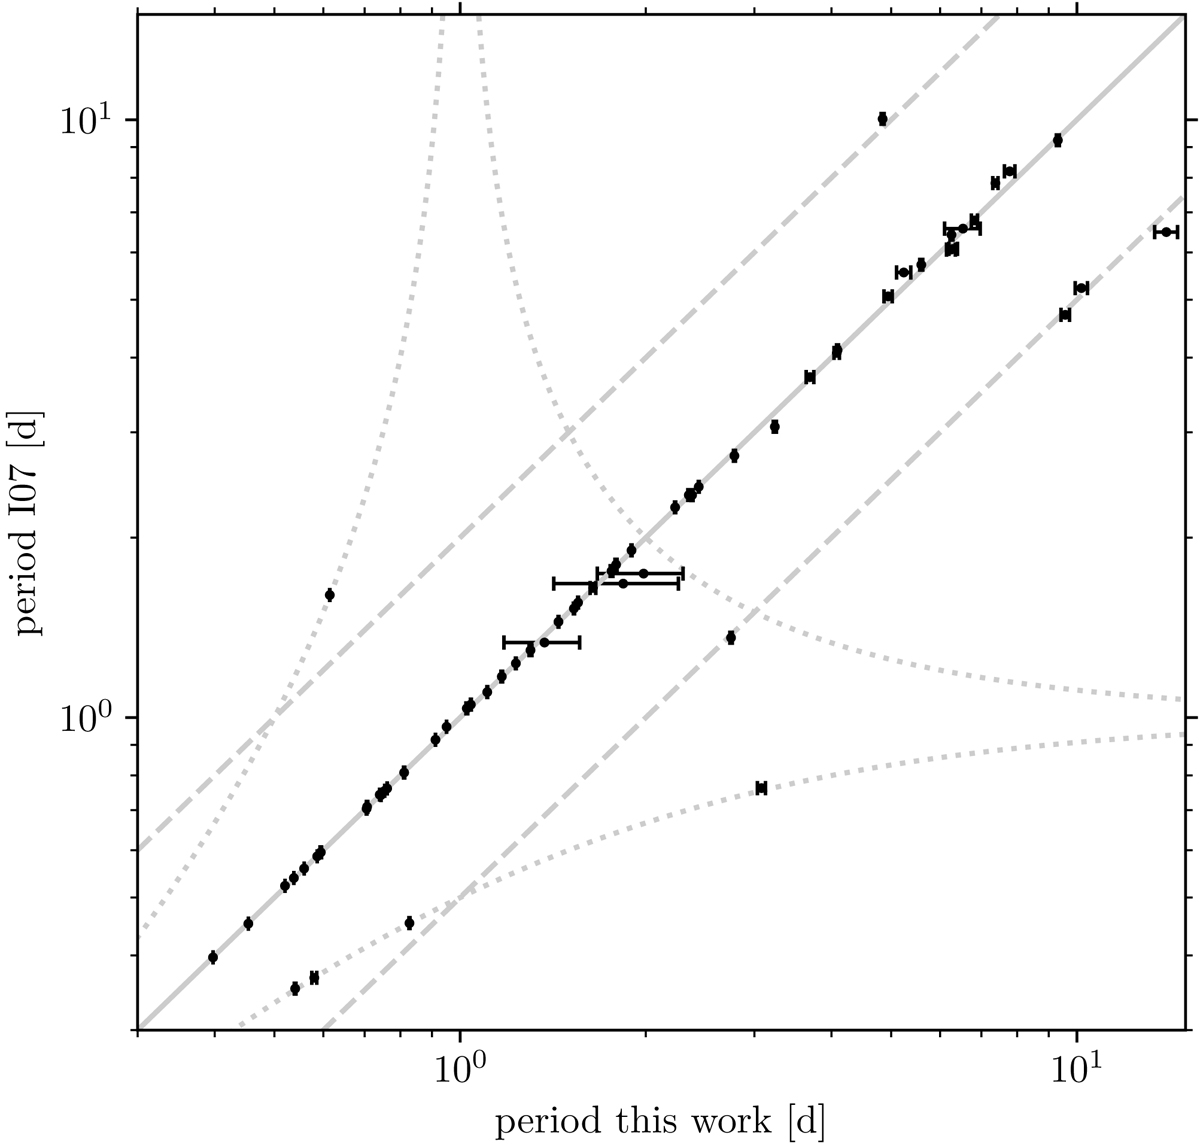
Comparison of our rotation periods with those measured by I07. The line of equality is shown as the solid grey line and the dashed lines indicate the half and double periods. The dotted lines show the beat periods of the observational period. The outliers are discussed in the text.
Current usage metrics show cumulative count of Article Views (full-text article views including HTML views, PDF and ePub downloads, according to the available data) and Abstracts Views on Vision4Press platform.
Data correspond to usage on the plateform after 2015. The current usage metrics is available 48-96 hours after online publication and is updated daily on week days.
Initial download of the metrics may take a while.