Fig. 59.
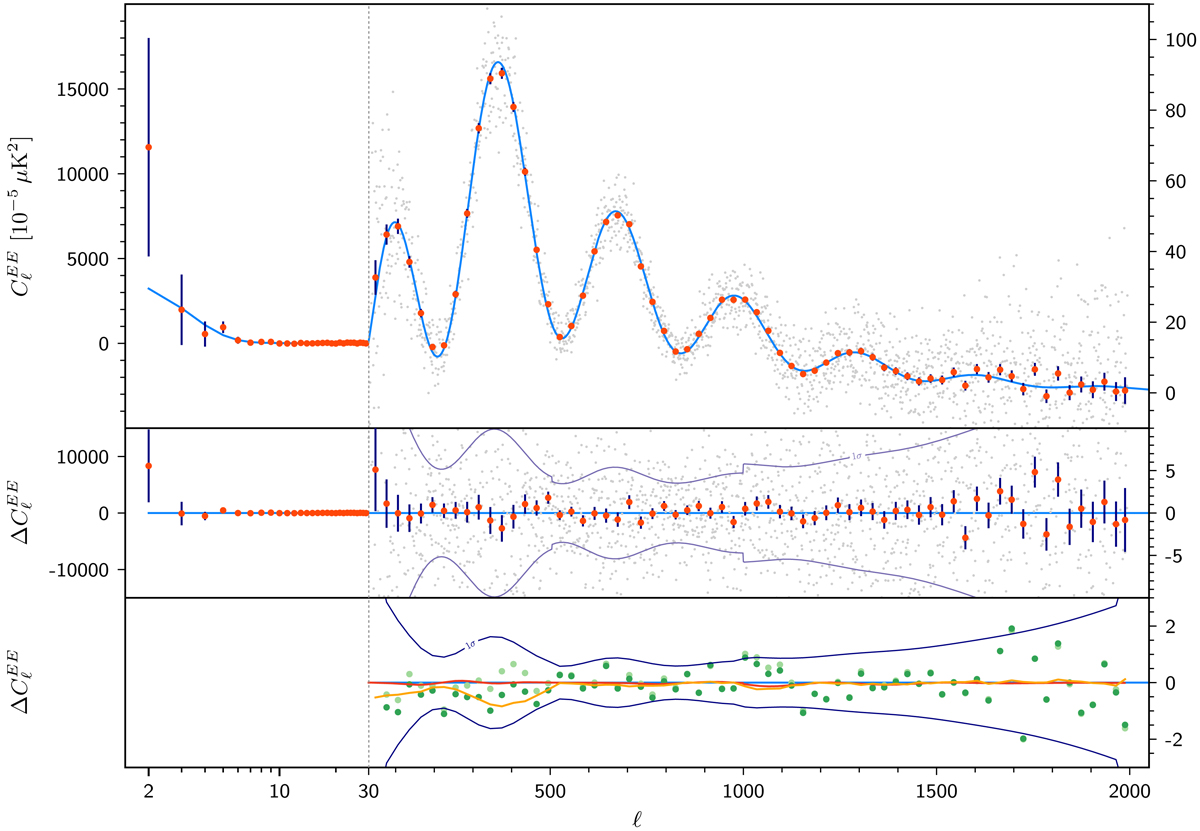
Planck 2018 EE power spectrum. Figure conventions are similar to those of Fig. 57. In the multipole range 2 ≤ ℓ ≤ 29, we plot the power spectra estimates from the SimAll likelihood. Bottom panels: difference between the 2015 and 2018 coadded high-multipole spectra (green points). The red and orange lines correspond to the effect of the beam-leakage correction and the addition of the beam-leakage and the polarization-efficiency corrections, respectively. Both corrections were absent in the 2015 data. The light green points show the difference between the 2015 and 2018 coadded spectra, after correction of the 2015 data by the two effects. The difference in EE is dominated by the polarization-efficiency correction.
Current usage metrics show cumulative count of Article Views (full-text article views including HTML views, PDF and ePub downloads, according to the available data) and Abstracts Views on Vision4Press platform.
Data correspond to usage on the plateform after 2015. The current usage metrics is available 48-96 hours after online publication and is updated daily on week days.
Initial download of the metrics may take a while.