Fig. 48.
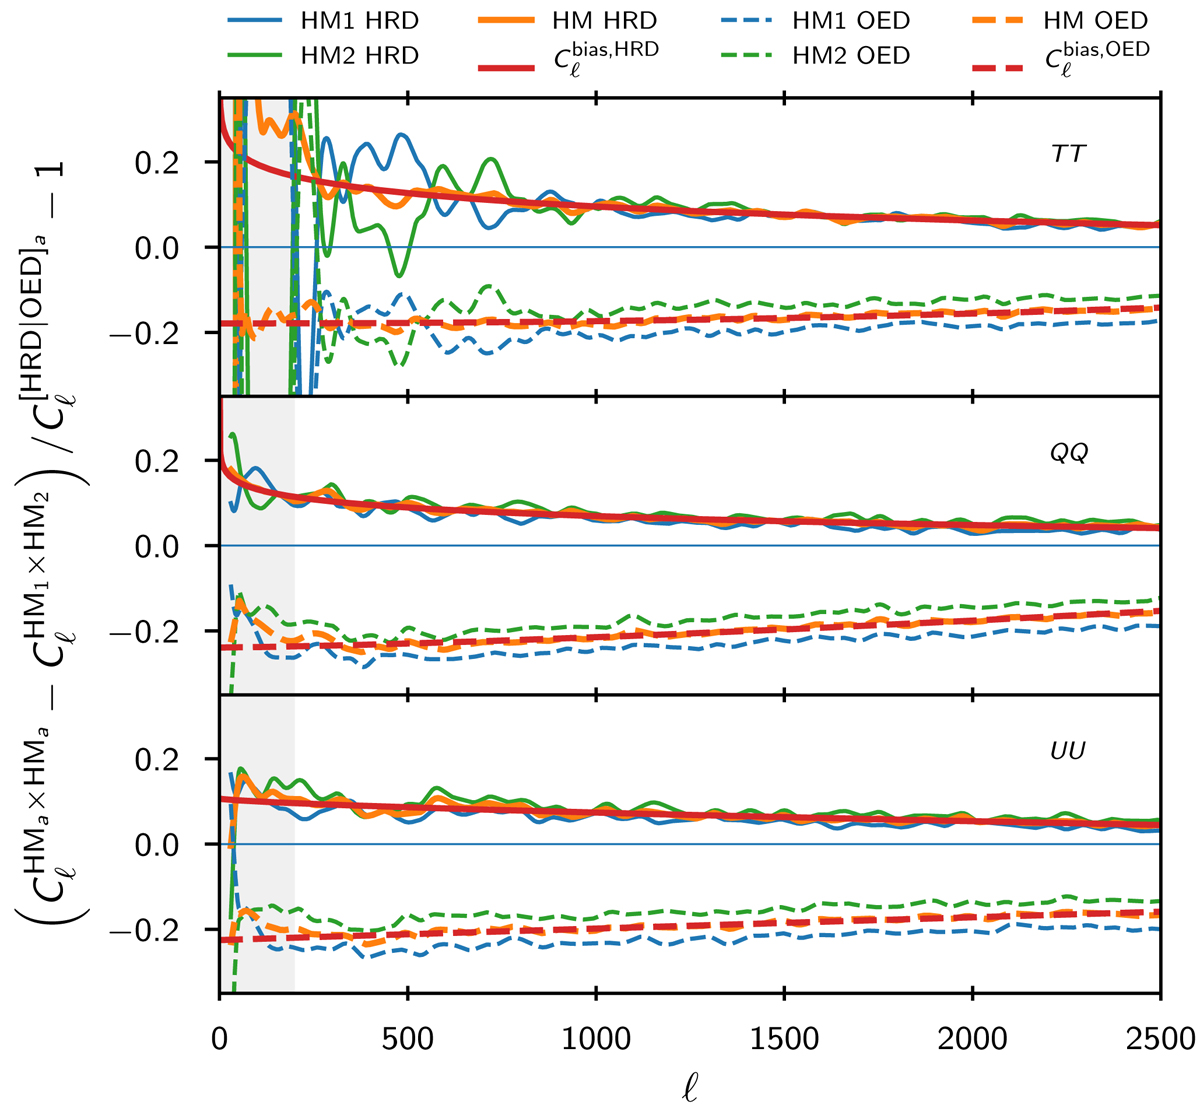
Correction (![]() ) for the noise estimates based on HRDs (solid lines) and OEDs (dashed lines), as described in Eqs. (35) and (36). Blue and green lines shows the two contribution to the bias estimates (i.e., for HM1 and HM2), showing that the bias is similar enough in each so that we can use the mean for the correction (orange line). The model fit (red) is obtained by restraining the fit to the non-shaded region (ℓ > 200). As we found in PPL15, HRD noise estimates are found to be biased low (due to correlations between half-ring maps, as explained in Planck Collaboration VI 2014). OED noise estimates, on the other hand, are biased high (in particular in polarization). Once the corresponding correction is applied to either case (HRD or OED), the overall noise models are similar. We only present here the 100 GHz channel results where the effect is the most striking. OEDs have very low anti-correlation for TT at 143 GHz and a slight correlation at 217 GHz, while the QQ and UU equivalents are still anticorrelated at all frequencies.
) for the noise estimates based on HRDs (solid lines) and OEDs (dashed lines), as described in Eqs. (35) and (36). Blue and green lines shows the two contribution to the bias estimates (i.e., for HM1 and HM2), showing that the bias is similar enough in each so that we can use the mean for the correction (orange line). The model fit (red) is obtained by restraining the fit to the non-shaded region (ℓ > 200). As we found in PPL15, HRD noise estimates are found to be biased low (due to correlations between half-ring maps, as explained in Planck Collaboration VI 2014). OED noise estimates, on the other hand, are biased high (in particular in polarization). Once the corresponding correction is applied to either case (HRD or OED), the overall noise models are similar. We only present here the 100 GHz channel results where the effect is the most striking. OEDs have very low anti-correlation for TT at 143 GHz and a slight correlation at 217 GHz, while the QQ and UU equivalents are still anticorrelated at all frequencies.
Current usage metrics show cumulative count of Article Views (full-text article views including HTML views, PDF and ePub downloads, according to the available data) and Abstracts Views on Vision4Press platform.
Data correspond to usage on the plateform after 2015. The current usage metrics is available 48-96 hours after online publication and is updated daily on week days.
Initial download of the metrics may take a while.