Fig. 44.
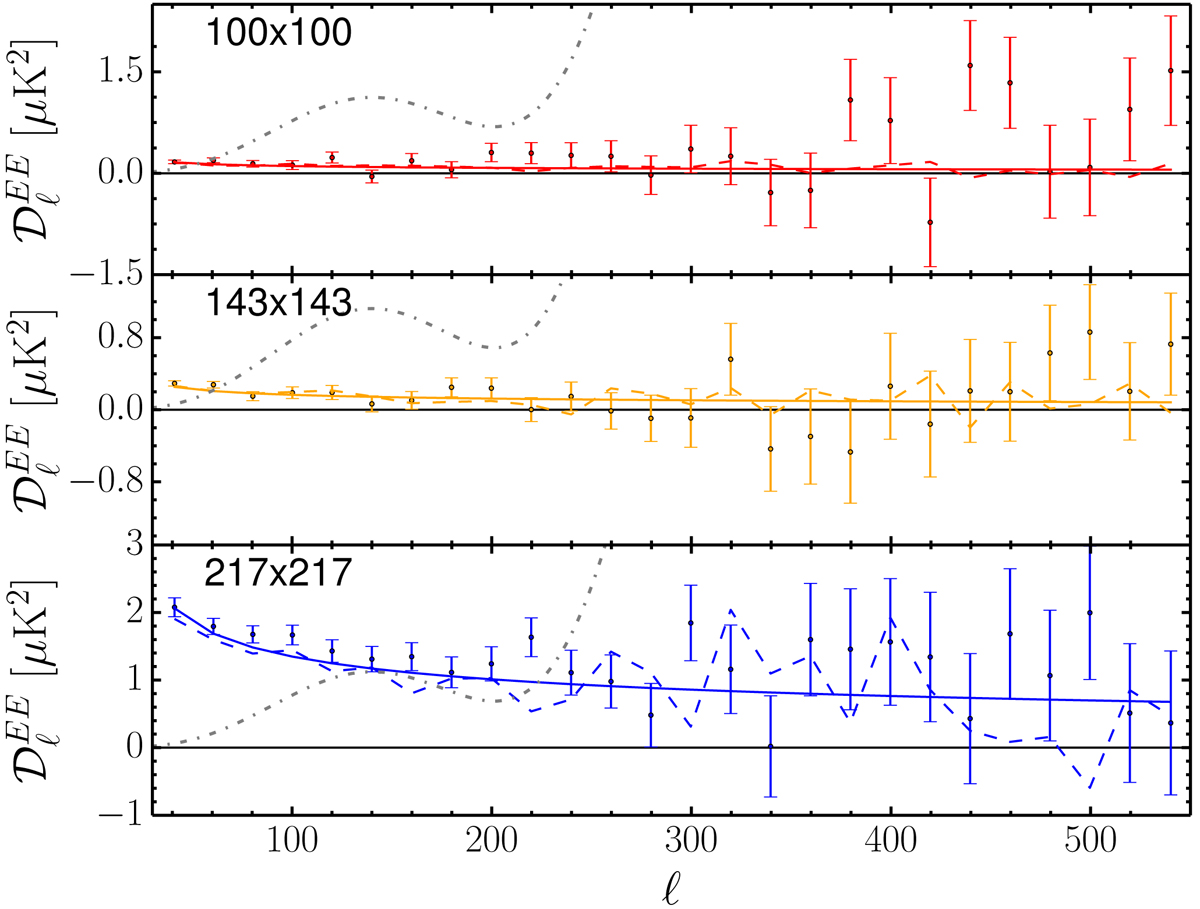
Comparison between the dust contribution to the EE power spectra, as estimated from the “dust cleaning” procedure in Eq. (32) (dashed lines), and the smooth power-law model used in the likelihood (solid lines). The data points are the 100 × 100, 143 × 143, and 217 × 217 spectra (from top to bottom) minus the best-fit Planck baseline 2018 results (shown in dot-dashed grey).
Current usage metrics show cumulative count of Article Views (full-text article views including HTML views, PDF and ePub downloads, according to the available data) and Abstracts Views on Vision4Press platform.
Data correspond to usage on the plateform after 2015. The current usage metrics is available 48-96 hours after online publication and is updated daily on week days.
Initial download of the metrics may take a while.