Fig. 42.
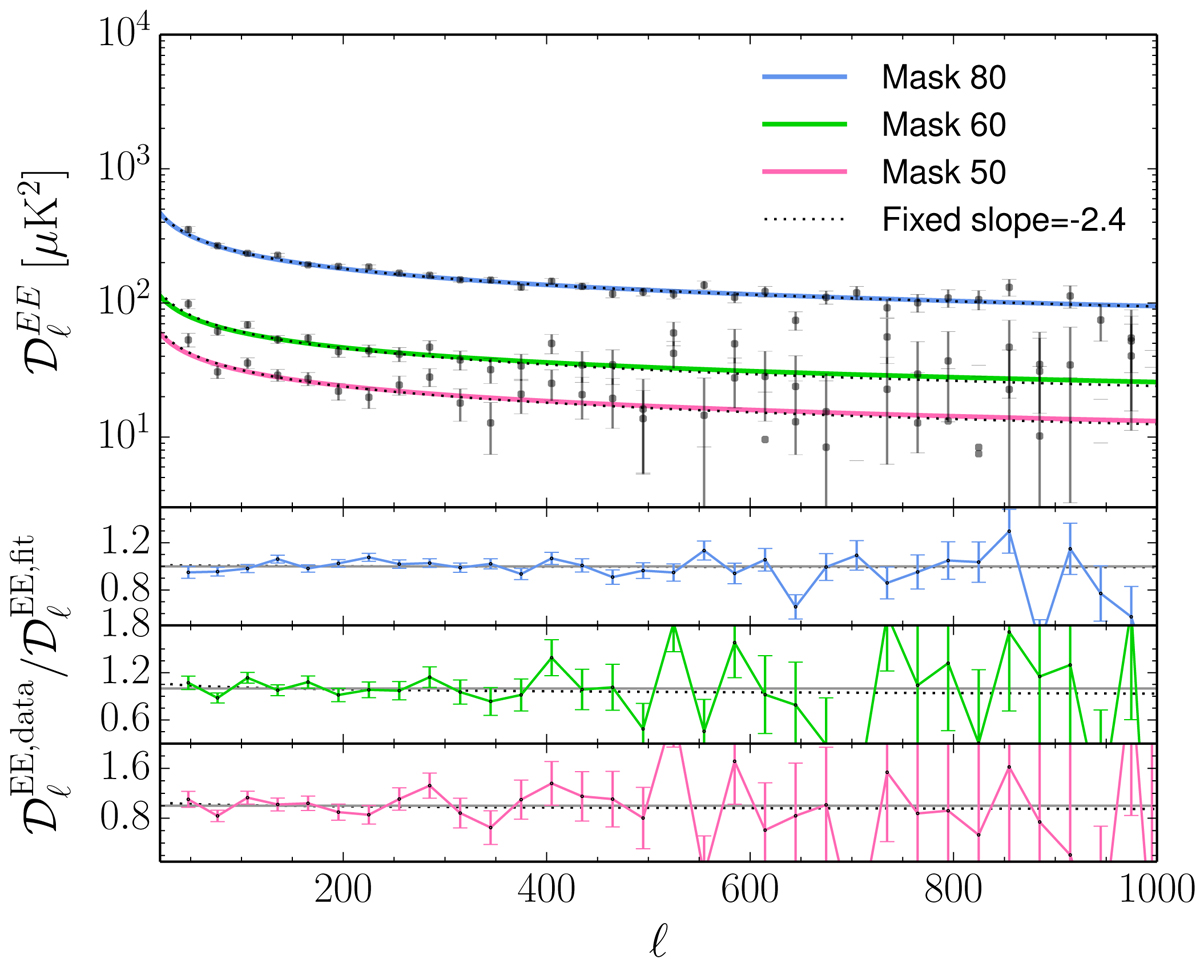
Dust EE templates. Upper panel: black data points are the 353 GHz, mask-differenced, half-mission spectra, calculated using the same masks as the ones used for the 100 × 100, 143 × 143, and 217 × 217 power spectra (from top to bottom, respectively) in the likelihood. The solid lines show the dust templates estimated fitting the data with a power law. The black dotted line shows templates with fixed slope Cℓ ∝ ℓ − 2.4, fit to the data. The fits with free slopes are in good agreement with the ones obtained with slope fixed at −2.4. The dust templates used in the likelihood thus assume the same slope of −2.4 at all frequencies. Lower panels: ratio between the data and the dust templates. The templates with fixed slope, whose ratios with the ones with free slopes are shown by the black dotted lines, differ from the ones with free slopes by less than 10%.
Current usage metrics show cumulative count of Article Views (full-text article views including HTML views, PDF and ePub downloads, according to the available data) and Abstracts Views on Vision4Press platform.
Data correspond to usage on the plateform after 2015. The current usage metrics is available 48-96 hours after online publication and is updated daily on week days.
Initial download of the metrics may take a while.