Fig. 36.
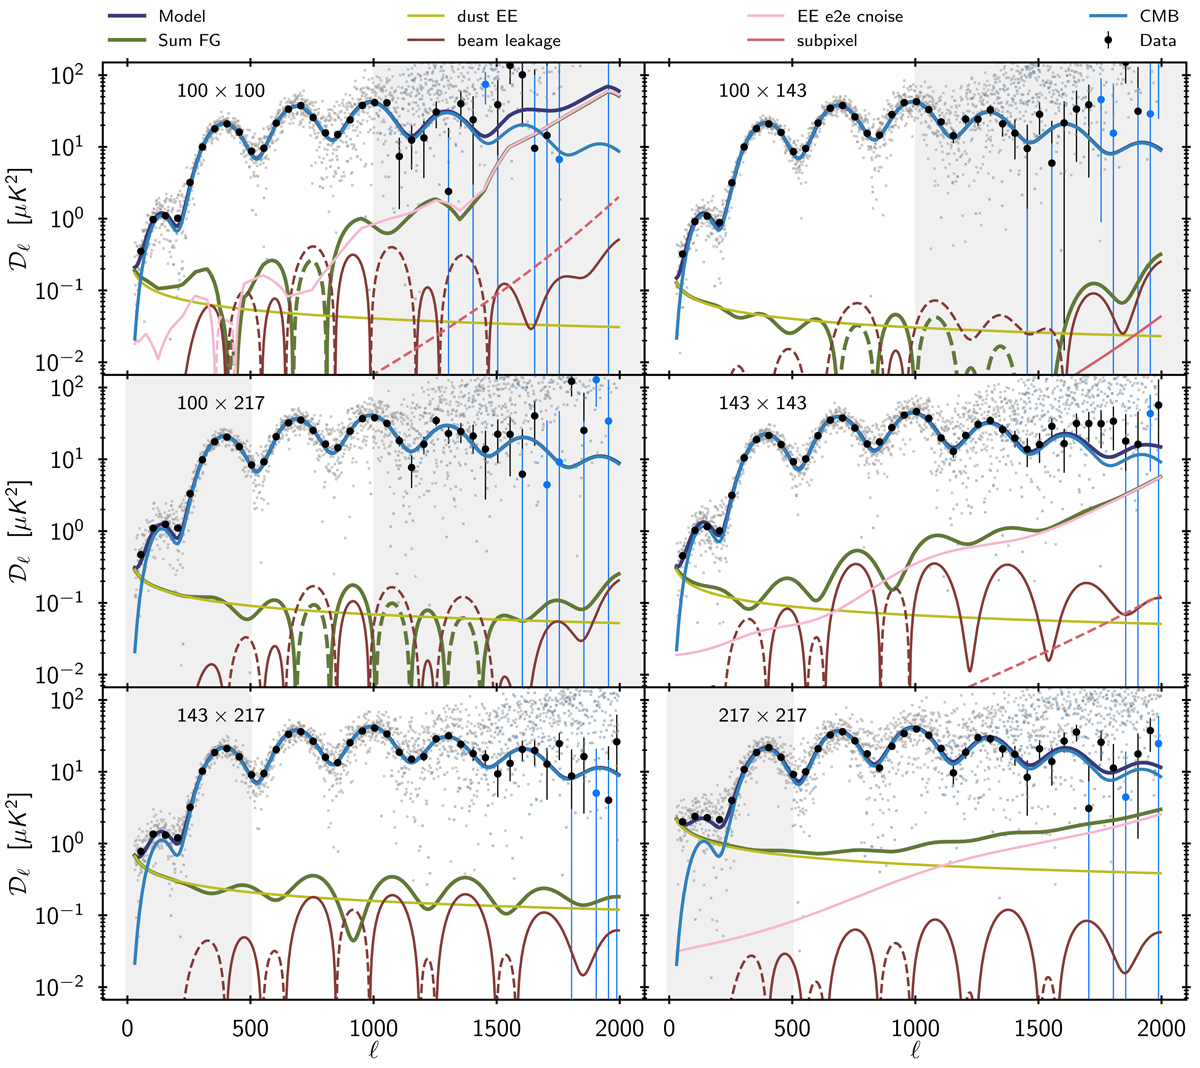
Best-fit model cross-spectra used for the EE high-ℓ likelihood. Black circles represent the data, binned at Δℓ = 50, while pale grey points show each multipole to give a sense of the scatter. Blue points and dashed lines correspond to negative values. The thick dark blue lines show the full model (sum of all components), and the dark green one is the sum of foreground and nuisance parts. Grey shaded areas are not used for cosmology.
Current usage metrics show cumulative count of Article Views (full-text article views including HTML views, PDF and ePub downloads, according to the available data) and Abstracts Views on Vision4Press platform.
Data correspond to usage on the plateform after 2015. The current usage metrics is available 48-96 hours after online publication and is updated daily on week days.
Initial download of the metrics may take a while.