Fig. 35.
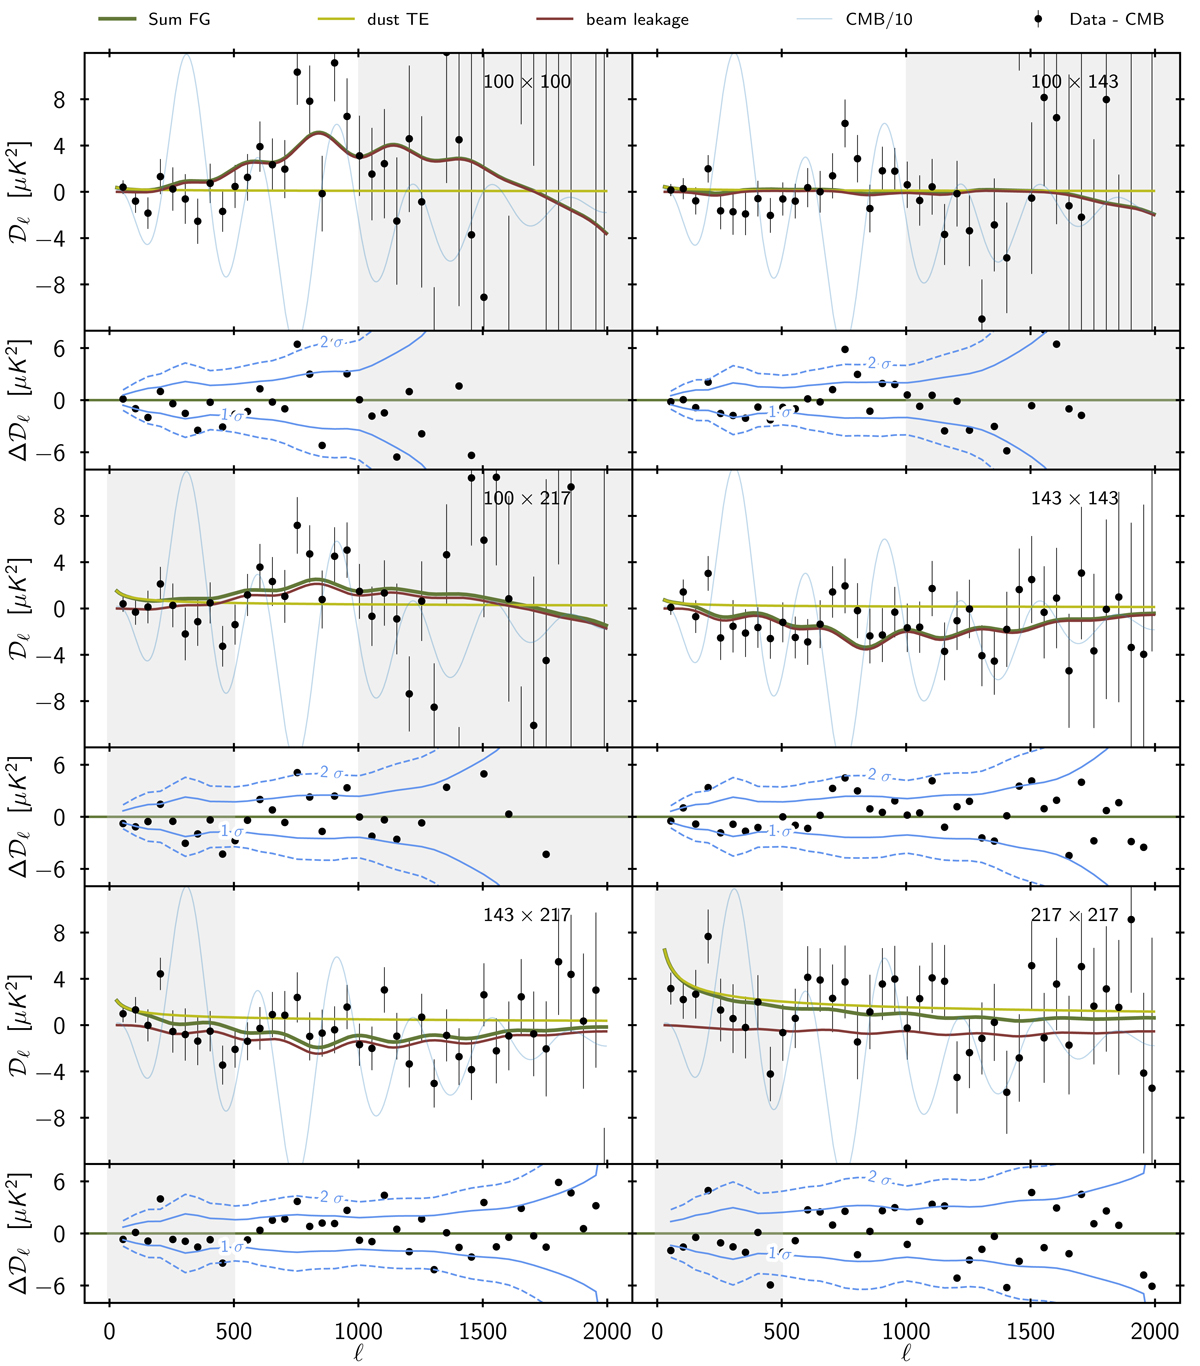
Best-fit foreground and nuisance models for all of the cross-spectra used in the TE high-ℓ likelihood. The data, with the best-fit theoretical CMB Cℓ spectrum subtracted, are shown in black with a binning of Δℓ = 50. The TE CMB spectra divided by 10 are shown in the top parts of each panel. The bottom parts of each panel show the residual after foreground and nuisance correction. Grey shaded areas indicate regions of multipole space not used for cosmology. Except at 217 × 217, beam leakage largely dominates the dust contributions in the ℓ ranges we keep.
Current usage metrics show cumulative count of Article Views (full-text article views including HTML views, PDF and ePub downloads, according to the available data) and Abstracts Views on Vision4Press platform.
Data correspond to usage on the plateform after 2015. The current usage metrics is available 48-96 hours after online publication and is updated daily on week days.
Initial download of the metrics may take a while.