Fig. 14.
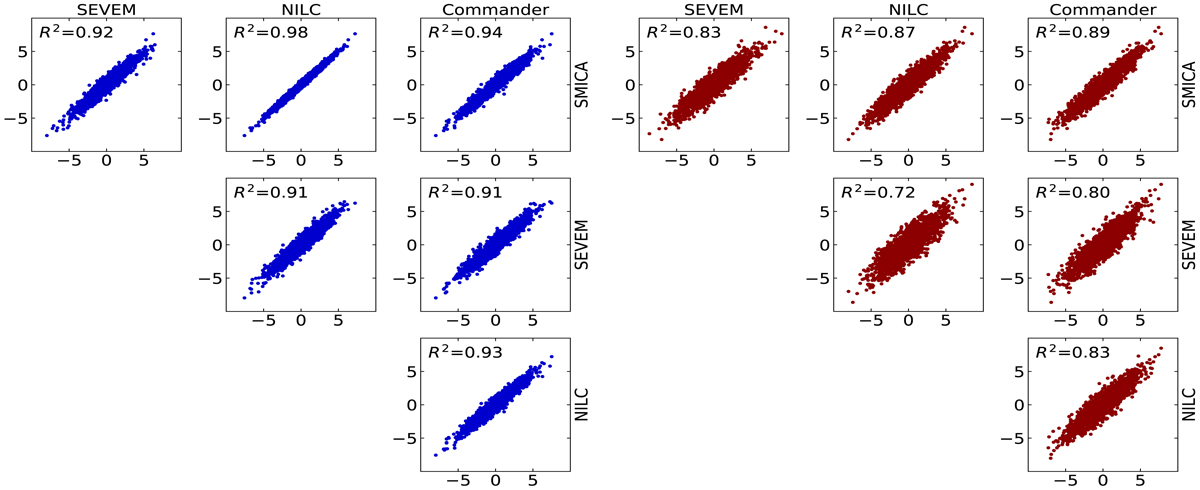
Scatter plots of the 2001 Modal 2 coefficients for each combination of component-separation methods, labelled with the R2 coefficient of determination. The figures on the left are for the temperature modes and those on the right for pure polarization modes (the Modal 2 pipeline reconstructs the component of the EEE bispectrum that is orthogonal to TTT, so this is not exactly the same as the EEE bispectrum of the other estimators).
Current usage metrics show cumulative count of Article Views (full-text article views including HTML views, PDF and ePub downloads, according to the available data) and Abstracts Views on Vision4Press platform.
Data correspond to usage on the plateform after 2015. The current usage metrics is available 48-96 hours after online publication and is updated daily on week days.
Initial download of the metrics may take a while.