Fig. 43.
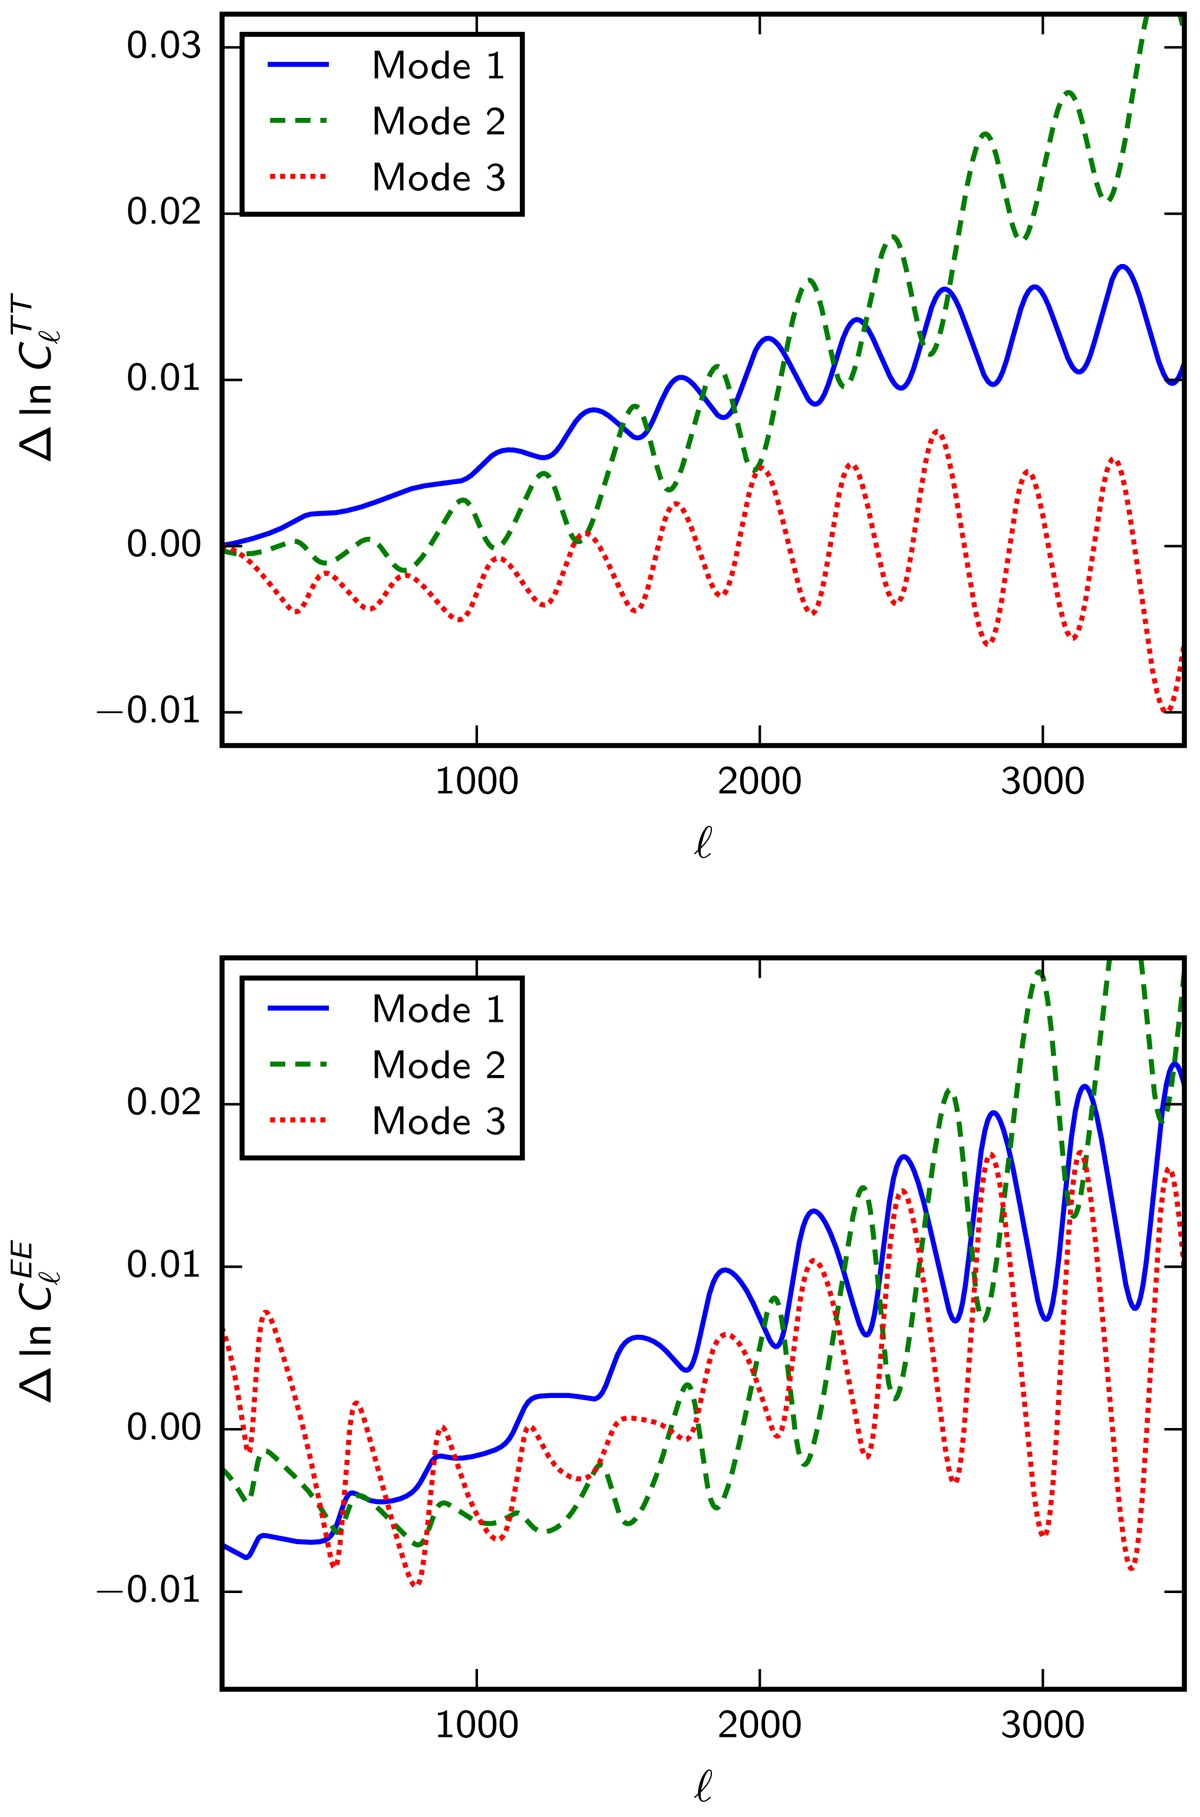
Power spectrum responses to the first three xe modes, constructed using Planck TT,TE,EE+lowE, shown in Fig. 42. For each curve, the corresponding xe mode was added to the standard recombination history with an amplitude corresponding to their predicted 1σ uncertainties (i.e., σμ1 = 0.16, σμ2 = 0.23, and σμ3 = 0.73 for the first three eXeMs).
Current usage metrics show cumulative count of Article Views (full-text article views including HTML views, PDF and ePub downloads, according to the available data) and Abstracts Views on Vision4Press platform.
Data correspond to usage on the plateform after 2015. The current usage metrics is available 48-96 hours after online publication and is updated daily on week days.
Initial download of the metrics may take a while.