Fig. 34.
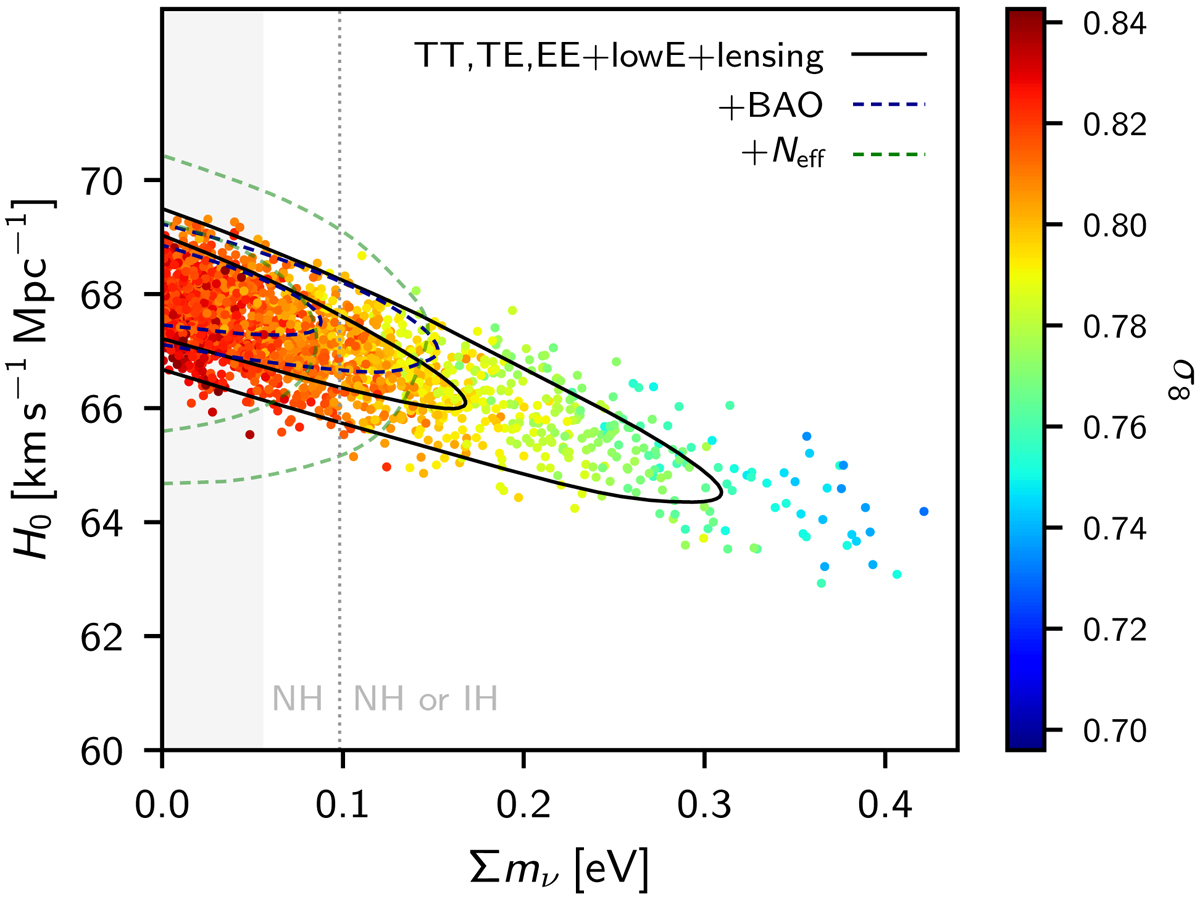
Samples from Planck TT,TE,EE+lowE chains in the ∑mν–H0 plane, colour-coded by σ8. Solid black contours show the constraints from Planck TT,TE,EE+lowE+lensing, while dashed blue lines show the joint constraint from Planck TT,TE,EE+lowE+lensing+BAO, and the dashed green lines additionally marginalize over Neff. The grey band on the left shows the region with ∑mν < 0.056 eV ruled out by neutrino oscillation experiments. Mass splittings observed in neutrino oscillation experiments also imply that the region left of the dotted vertical line can only be a normal hierarchy (NH), while the region to the right could be either the normal hierarchy or an inverted hierarchy (IH).
Current usage metrics show cumulative count of Article Views (full-text article views including HTML views, PDF and ePub downloads, according to the available data) and Abstracts Views on Vision4Press platform.
Data correspond to usage on the plateform after 2015. The current usage metrics is available 48-96 hours after online publication and is updated daily on week days.
Initial download of the metrics may take a while.