Fig. 31.
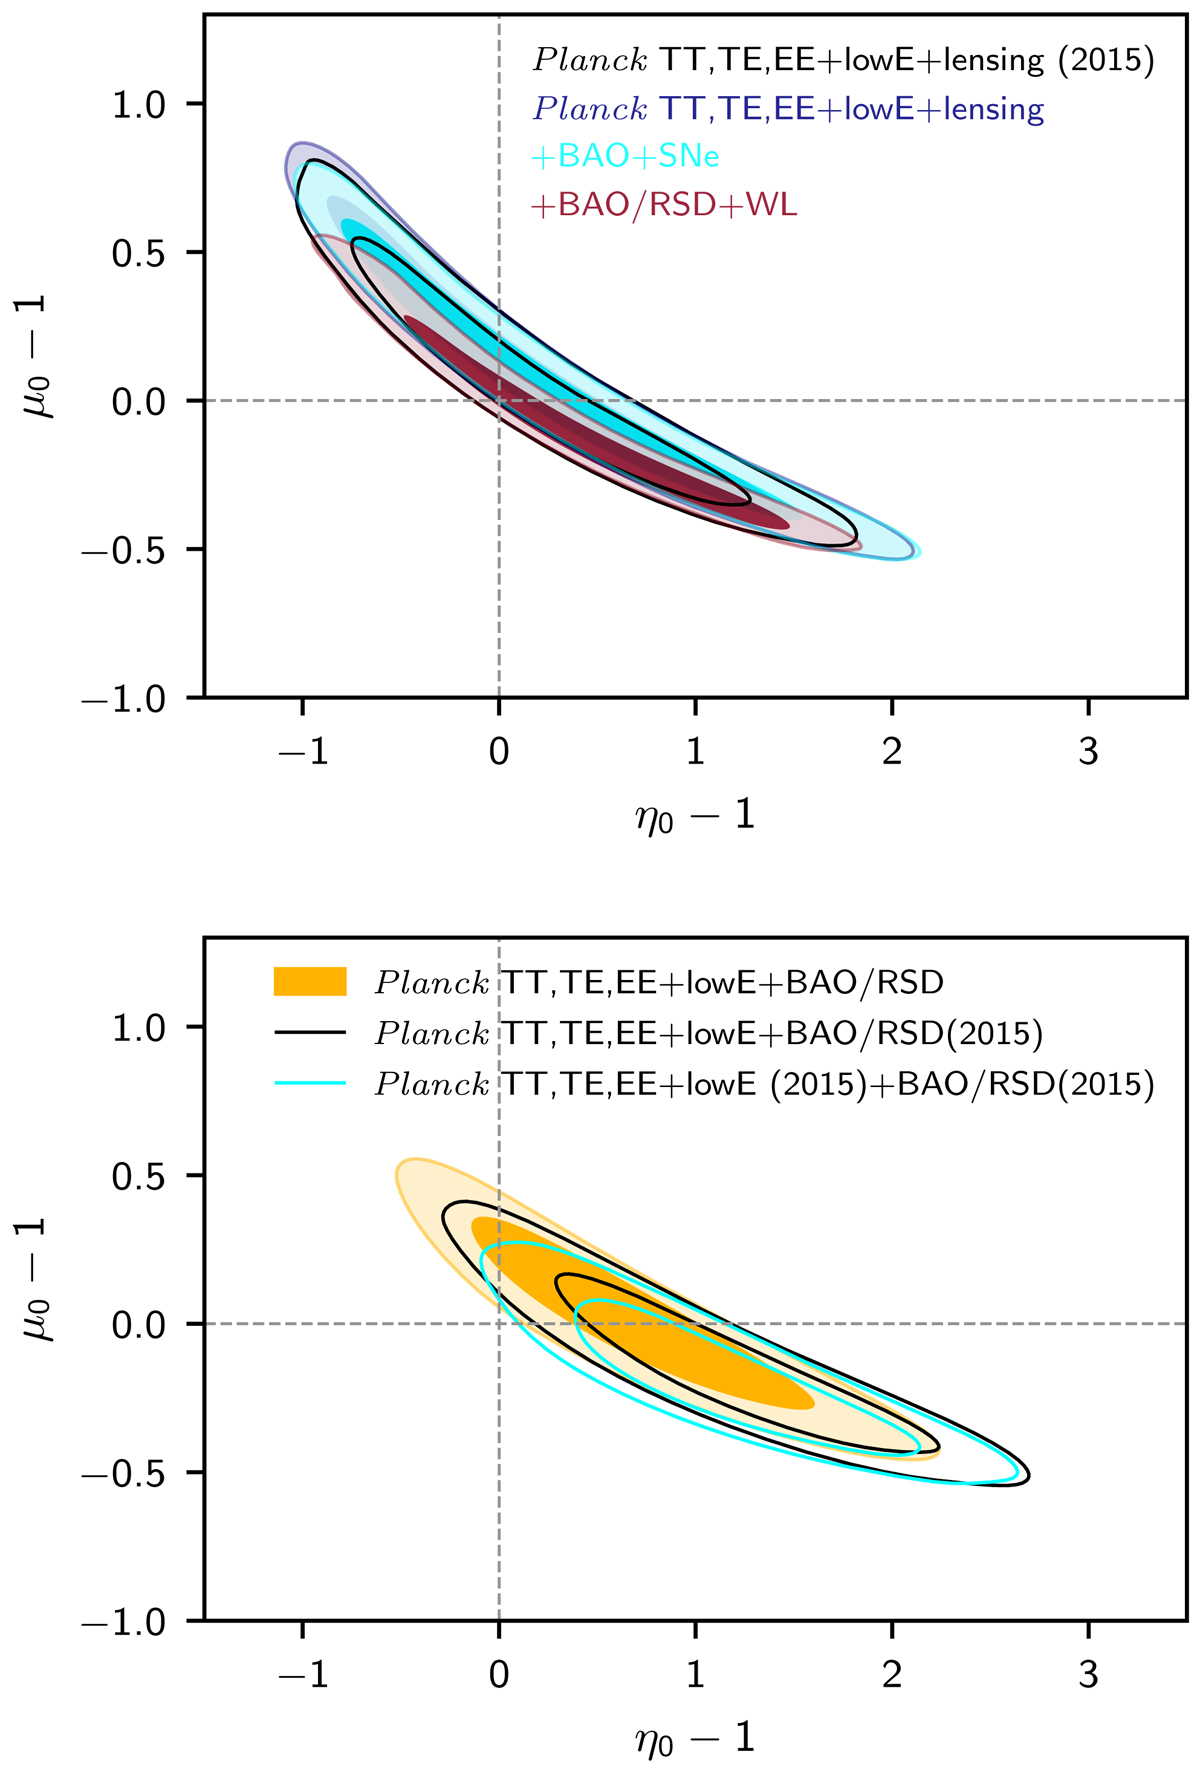
Top: marginalized posterior distributions of the MG parameters μ and η for Planck TT,TE,EE+lowE+lensing data alone and in combination with external data (as indicated in the legend), using the late-time parameterization and neglecting any scale dependence. The dashed lines show the standard ΛCDM model. Bottom: impact of the BAO/RSD and Planck TT,TE,EE+lowE data, compared to the 2015 results. For the 2018 Planck data, the contours shift towards lower values of η0 − 1, along the maximum degeneracy line (black versus cyan contours) and shift in the same direction when using the BAO/RSD data (yellow versus black contours).
Current usage metrics show cumulative count of Article Views (full-text article views including HTML views, PDF and ePub downloads, according to the available data) and Abstracts Views on Vision4Press platform.
Data correspond to usage on the plateform after 2015. The current usage metrics is available 48-96 hours after online publication and is updated daily on week days.
Initial download of the metrics may take a while.