Fig. 2.
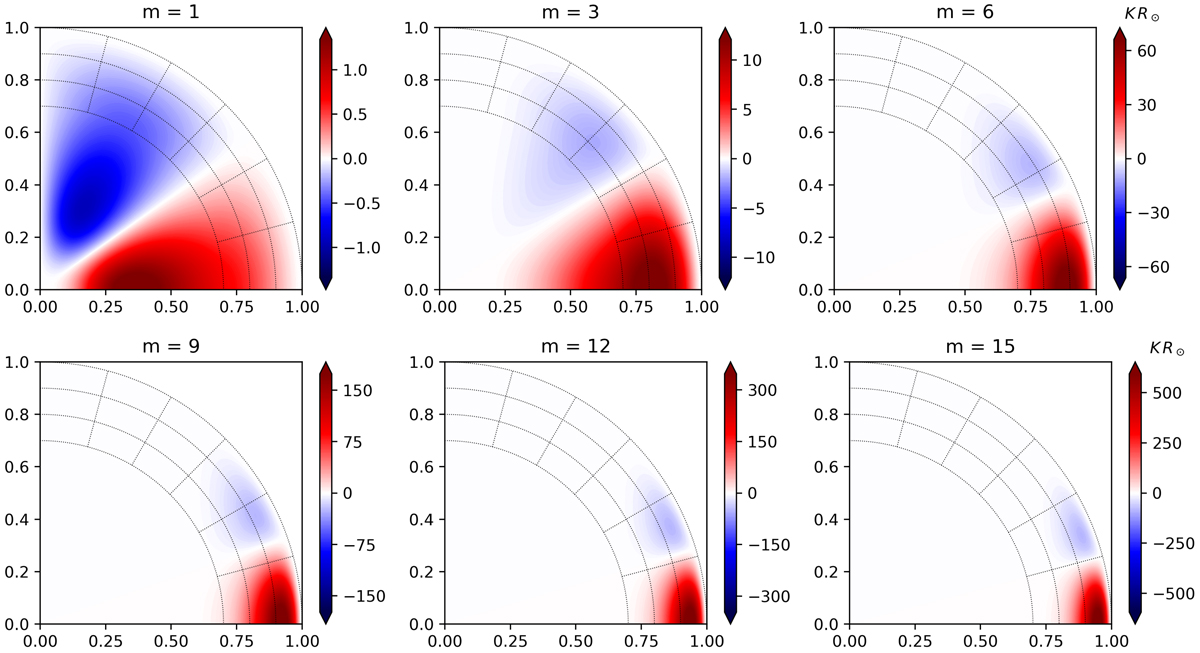
Kernels for the sensitivity of sectoral Rossby waves to variations in rotation rate for azimuthal orders m = 1, 3, 6, 9, 12, and 15 (from left to right, top to bottom). The different panels show the kernels in the meridional plane and the kernels are symmetric about the equator. The vertical axis is the rotation axis. The spatial grid is in units of R⊙, and the grided region denotes the convection zone.
Current usage metrics show cumulative count of Article Views (full-text article views including HTML views, PDF and ePub downloads, according to the available data) and Abstracts Views on Vision4Press platform.
Data correspond to usage on the plateform after 2015. The current usage metrics is available 48-96 hours after online publication and is updated daily on week days.
Initial download of the metrics may take a while.