Fig. 1.
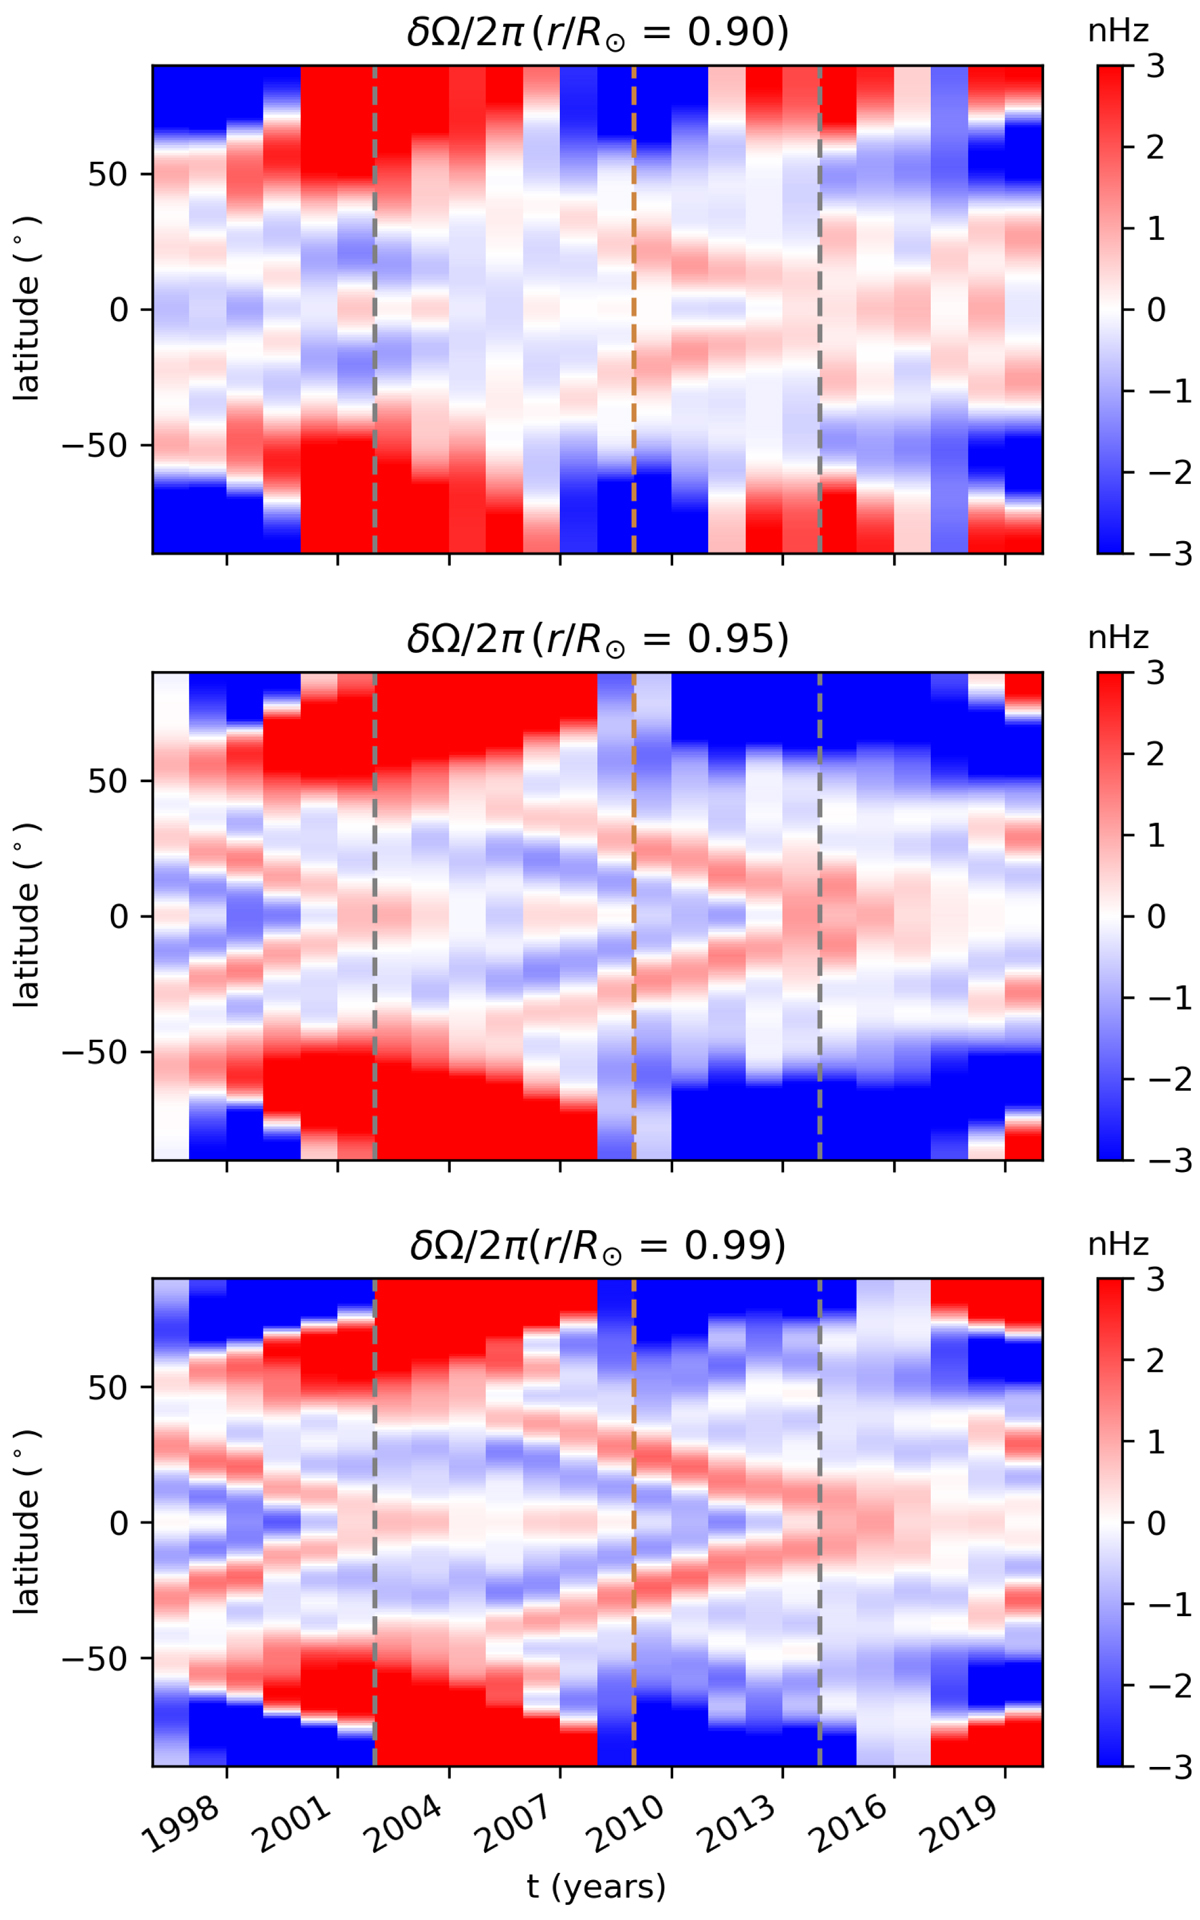
Rotation rate residuals, δΩ(r, θ, t)/2π, at r = 0.9, 0.95, and 0.99 R⊙ for 1996-Jun.-06 to 2019-Jun.-30. The data is binned for each calendar year, and the colour scale is saturated at ±3 nHz. The vertical dashed grey lines denote the positions of the maxima of solar cycles 23 and 24 (2002 and 2014). The vertical dashed brown line indicates the minimum between the two cycles (2009).
Current usage metrics show cumulative count of Article Views (full-text article views including HTML views, PDF and ePub downloads, according to the available data) and Abstracts Views on Vision4Press platform.
Data correspond to usage on the plateform after 2015. The current usage metrics is available 48-96 hours after online publication and is updated daily on week days.
Initial download of the metrics may take a while.