Fig. 2.
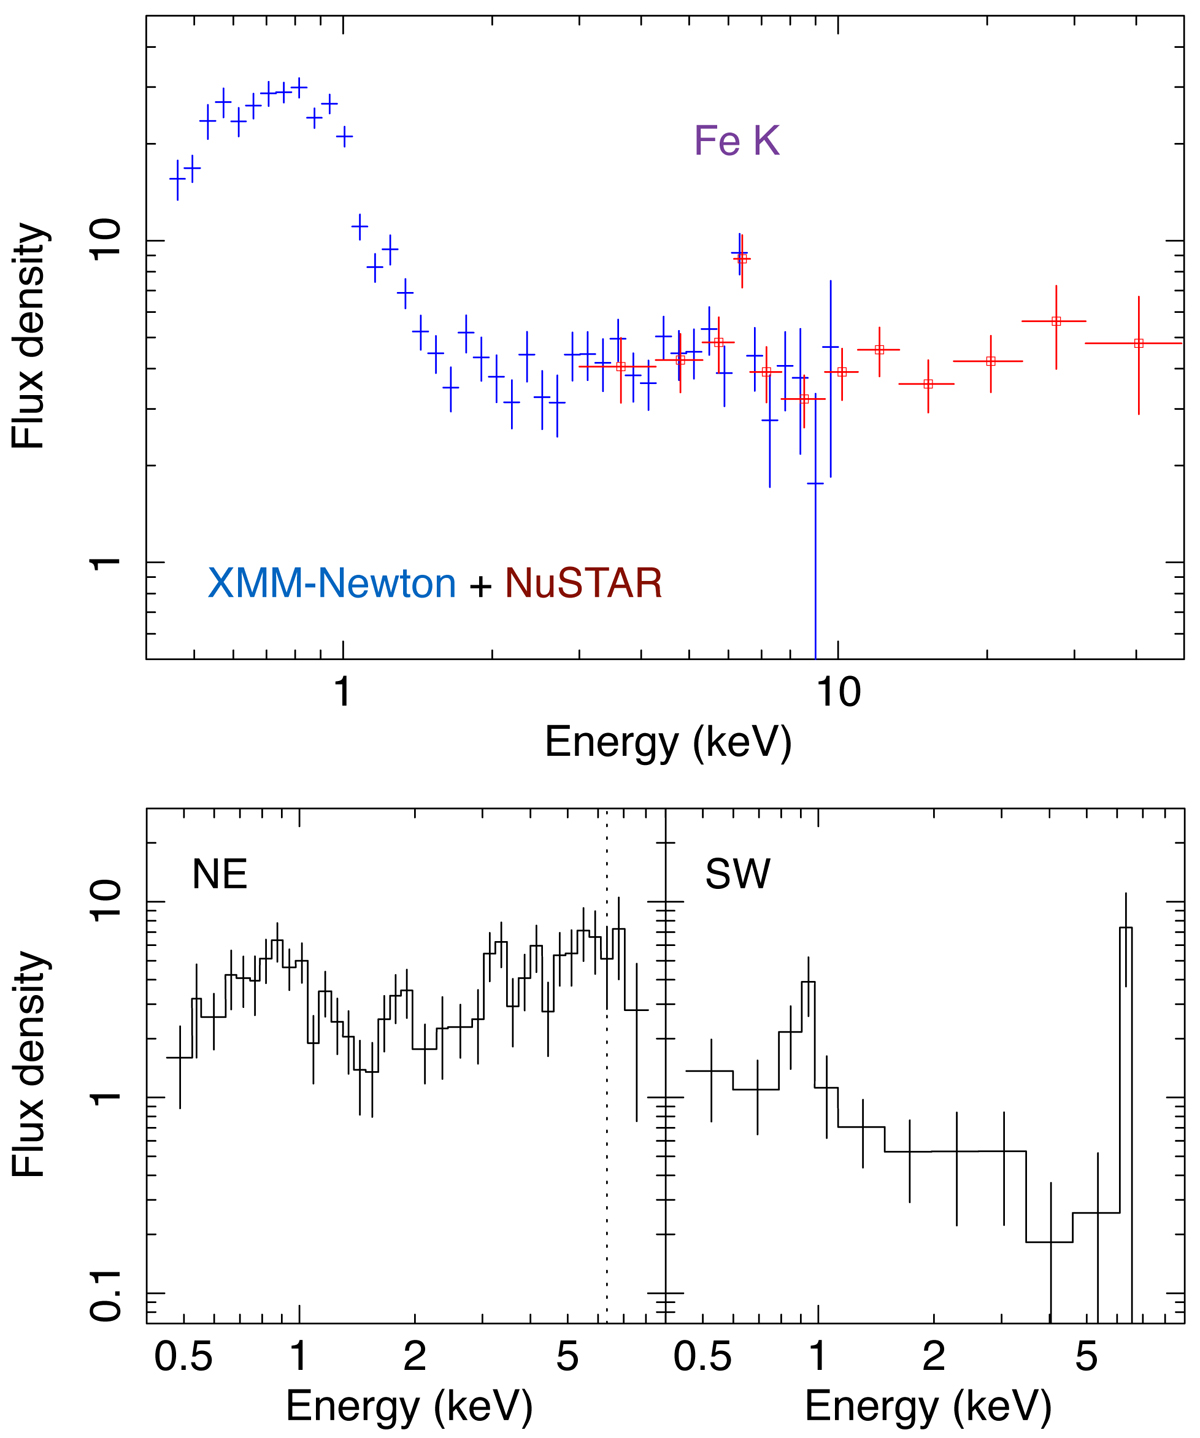
Upper panel: flux density spectrum of integrated emission of Mrk 266, containing both NE and SW nuclei. Data from XMM-Newton (blue) and NuSTAR (red squares) are plotted. The flux density is in units of 10−14 erg s−1 cm−2 keV−1. For display purposes, the NuSTAR data used for the spectral analysis were rebinned further. The Fe K emission line feature at 6.5 keV is marked. Bottom panel: spectra of the NE and SW nuclei obtained from the Chandra ACIS. Since Fe K line emission is absent in the NE spectrum (the line energy is denoted by the vertical dotted line), the Fe K line seen in the XMM-Newton and NuSTAR spectra seems to originate predominantly from the SW.
Current usage metrics show cumulative count of Article Views (full-text article views including HTML views, PDF and ePub downloads, according to the available data) and Abstracts Views on Vision4Press platform.
Data correspond to usage on the plateform after 2015. The current usage metrics is available 48-96 hours after online publication and is updated daily on week days.
Initial download of the metrics may take a while.