Free Access
Fig. 7
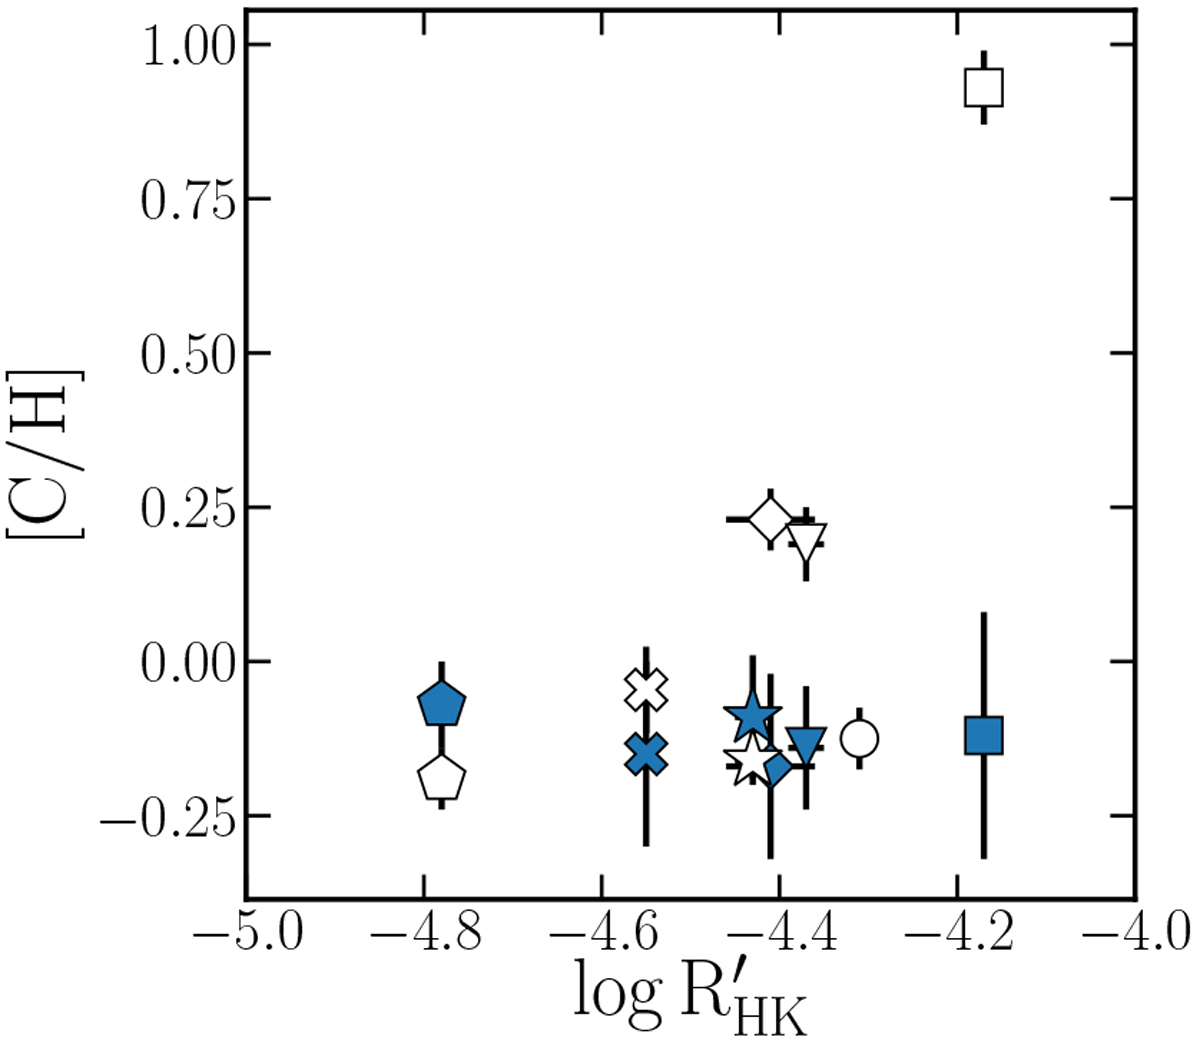
Abundances of C I derived from atomic lines in the optical range (empty symbols) and from the CH molecular features (blue symbols) as a function of the activity index
![]() . The symbols are the same as in Fig. 6.
. The symbols are the same as in Fig. 6.
Current usage metrics show cumulative count of Article Views (full-text article views including HTML views, PDF and ePub downloads, according to the available data) and Abstracts Views on Vision4Press platform.
Data correspond to usage on the plateform after 2015. The current usage metrics is available 48-96 hours after online publication and is updated daily on week days.
Initial download of the metrics may take a while.