Fig. 4
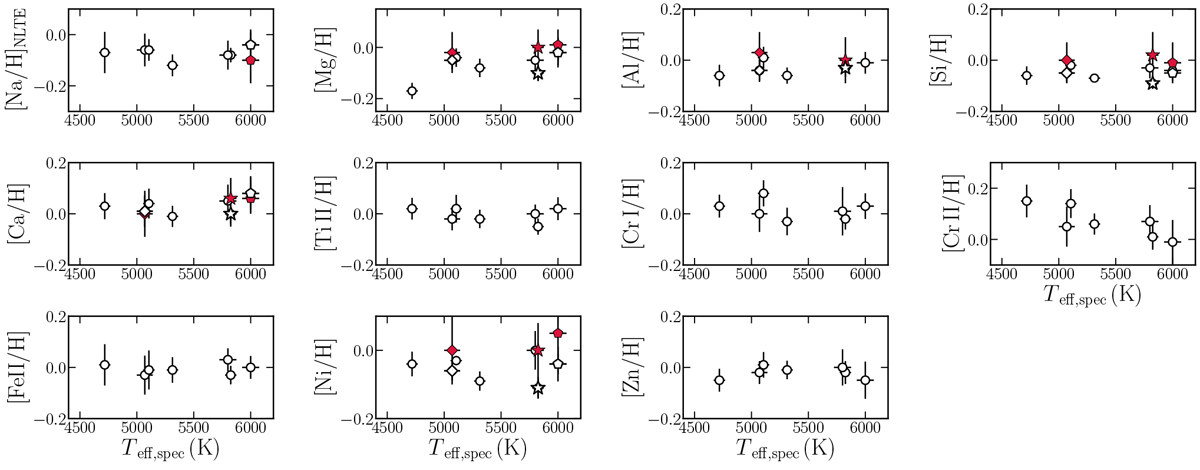
Individual values of [X/H] as a function of spectroscopic estimates of Teff, derived from the analysis of the optical spectra (open symbols) and from the analysis of NIR spectra (red symbols). The symbols for the three stars for which we analysed GIARPS spectra are the same as in Fig. 3. All trends have Pearson correlation coefficients that are not significant at p < 0.1, apart from Cr II (see the text for details).
Current usage metrics show cumulative count of Article Views (full-text article views including HTML views, PDF and ePub downloads, according to the available data) and Abstracts Views on Vision4Press platform.
Data correspond to usage on the plateform after 2015. The current usage metrics is available 48-96 hours after online publication and is updated daily on week days.
Initial download of the metrics may take a while.