Fig. 3
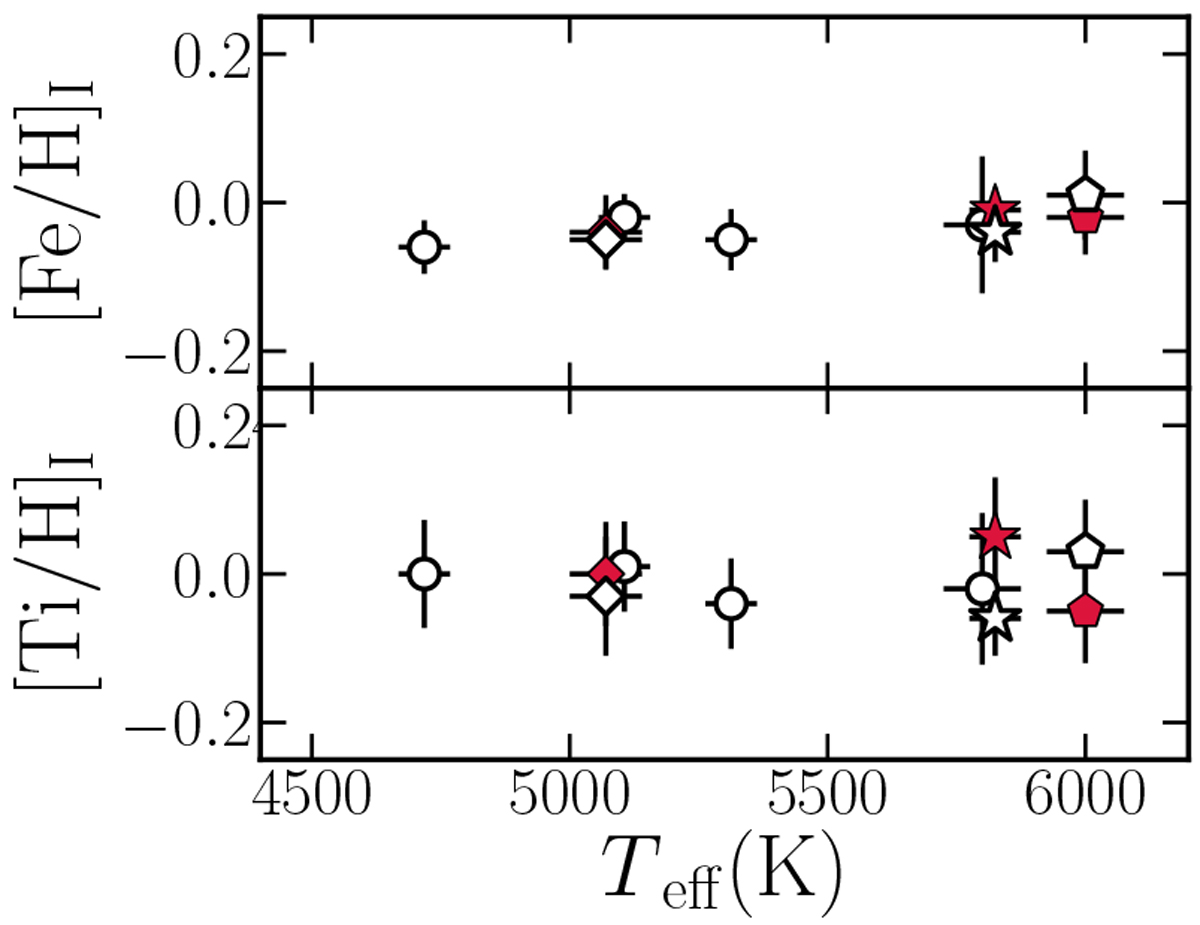
Abundances of Fe I and Ti I as function of Teff. The open symbols represent the optical measurements, while the red symbols indicate the NIR measurements. The diamond indicates TYC 1991-1235-1, the star symbol represents HIP 61205, and the pentagon denotes HD 167389, for which we have both optical and NIR measurements. The Pearson correlation coefficient of the trend in the top panel is r = 0.67, which is not significant at p < 0.1. For Ti the Pearson correlation coefficient is r = −0.03, which is not significant at p < 0.1.
Current usage metrics show cumulative count of Article Views (full-text article views including HTML views, PDF and ePub downloads, according to the available data) and Abstracts Views on Vision4Press platform.
Data correspond to usage on the plateform after 2015. The current usage metrics is available 48-96 hours after online publication and is updated daily on week days.
Initial download of the metrics may take a while.