Fig. 7.
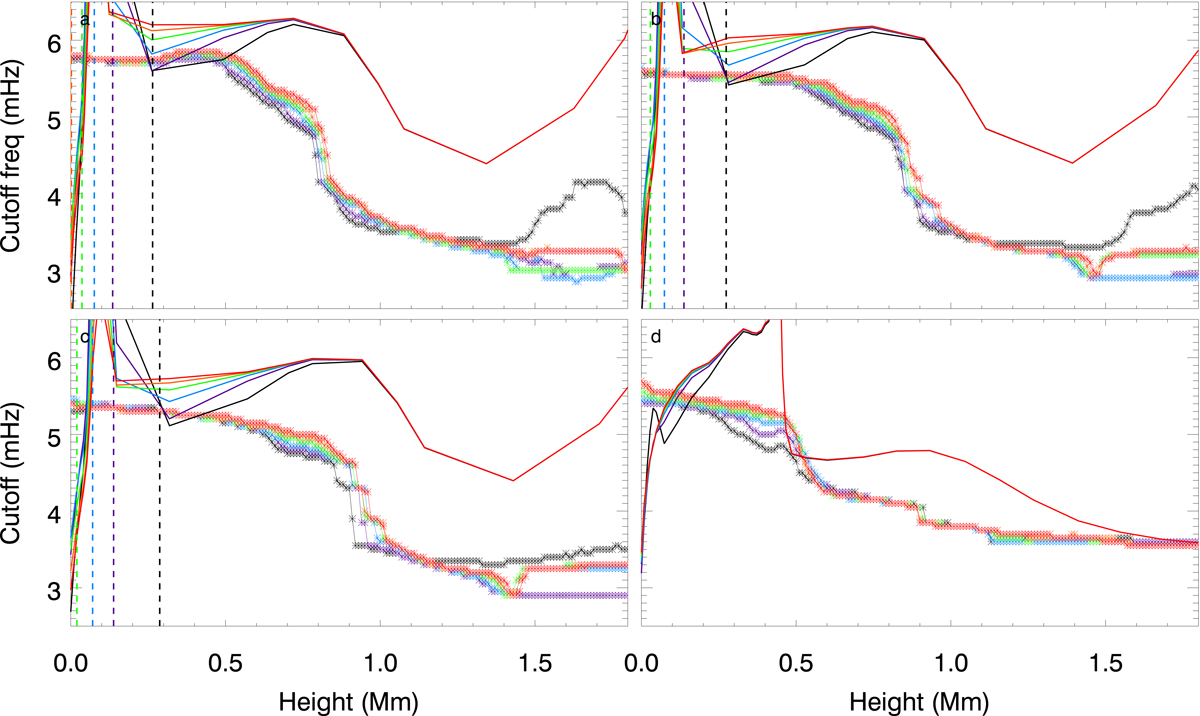
Variation in numerically determined cutoff frequency with height in the umbral models eMaltby (panel a), mMaltby (panel b), lMaltby (panel c), and Avrett2015spot (panel d). Each color corresponds to atmospheres permeated by a different strength of the vertical magnetic field: 500 G (black), 1000 G (violet), 1500 G (light blue), 2000 G (green), 2500 G (orange), and 3000 G (red). The vertical dashed lines mark the height where the plasma-β is unity, following the same color code as the cutoff values. For some of the atmospheres, the line indicating the β = 1 height is not visible because it is below z = 0. Solid lines show the cutoff frequency of slow magnetoacoustic waves in atmospheres, as given by Eq. (4). Their color indicates the strength of the magnetic field.
Current usage metrics show cumulative count of Article Views (full-text article views including HTML views, PDF and ePub downloads, according to the available data) and Abstracts Views on Vision4Press platform.
Data correspond to usage on the plateform after 2015. The current usage metrics is available 48-96 hours after online publication and is updated daily on week days.
Initial download of the metrics may take a while.