Fig. 6.
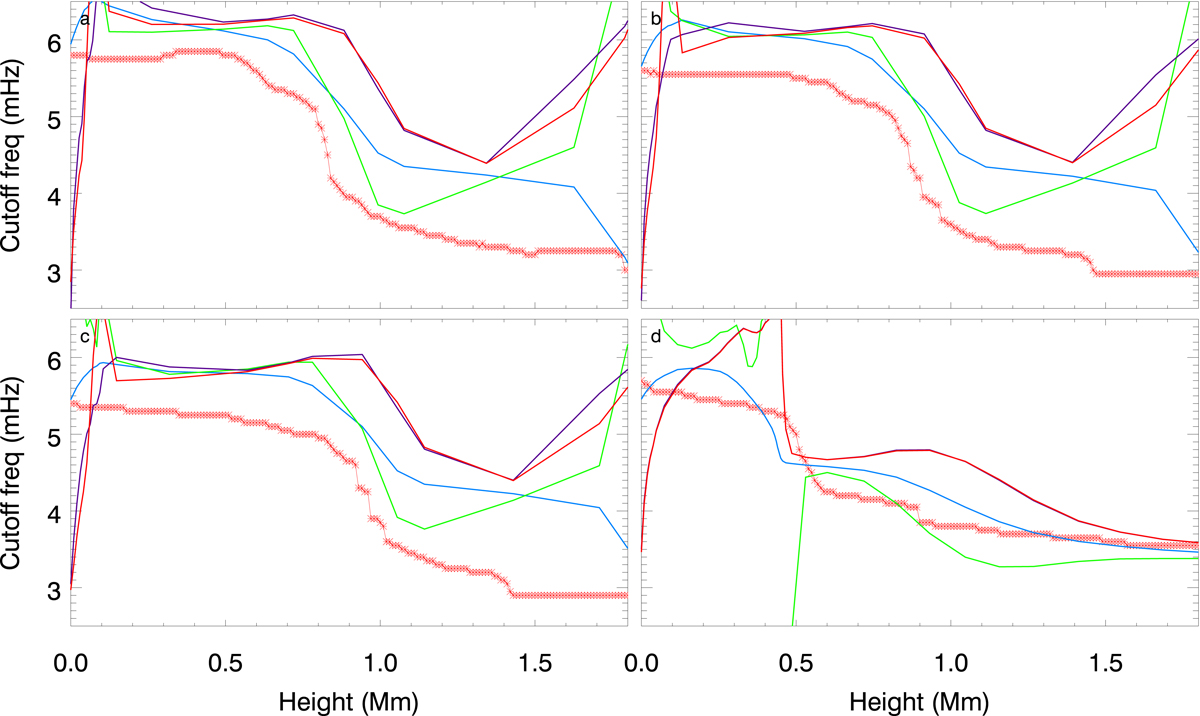
Variation in cutoff frequency with height in the umbral models eMaltby (panel a), mMaltby (panel b), lMaltby (panel c), and Avrett2015spot (panel d). The red lines with asterisks show the cutoff values determined from examining phase-difference spectra in numerical simulations with a vertical magnetic field of 3000 G. Color lines indicate the analytical cutoff frequency computed using Eq. (1) (blue line), Eq. (2) (green line), Eq. (3) (violet line), and Eq. (4) (red line). All the plotted heights are in the β < 1 region.
Current usage metrics show cumulative count of Article Views (full-text article views including HTML views, PDF and ePub downloads, according to the available data) and Abstracts Views on Vision4Press platform.
Data correspond to usage on the plateform after 2015. The current usage metrics is available 48-96 hours after online publication and is updated daily on week days.
Initial download of the metrics may take a while.