Fig. 3.
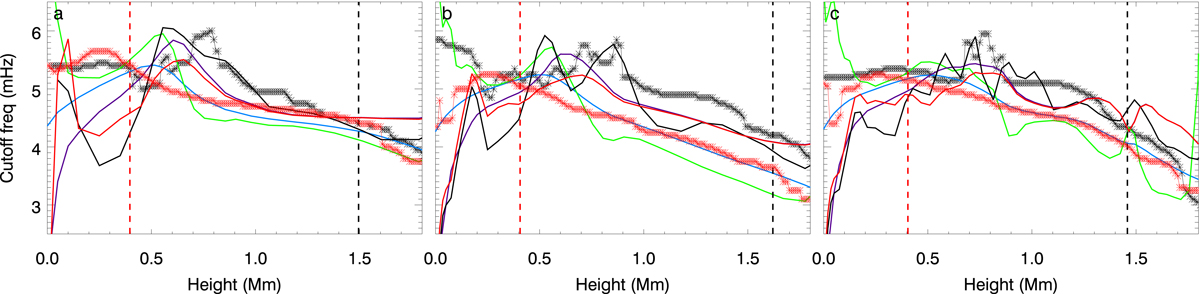
Variation of the cutoff frequency with height in the quiet-Sun models VALC (panel a), FALC (panel b), and Avrett2015QS (panel c). The lines with asterisks show the cutoff values determined from the examination of the phase-difference spectra in a numerical simulation with a vertical magnetic field of 5 G (black) and 300 G (red). Color lines indicate the analytical cutoff frequency computed using Eq. (1) (blue line), Eq. (2) (green line), Eq. (3) (violet line), Eq. (4) with 5 G magnetic field strength (black line), and Eq. (4) with 300 G magnetic field strength (red line). The vertical dashed lines mark the height where the plasma-β is unity for the models with a field strength of 5 G (black) and 300 G (red).
Current usage metrics show cumulative count of Article Views (full-text article views including HTML views, PDF and ePub downloads, according to the available data) and Abstracts Views on Vision4Press platform.
Data correspond to usage on the plateform after 2015. The current usage metrics is available 48-96 hours after online publication and is updated daily on week days.
Initial download of the metrics may take a while.