Fig. 2.
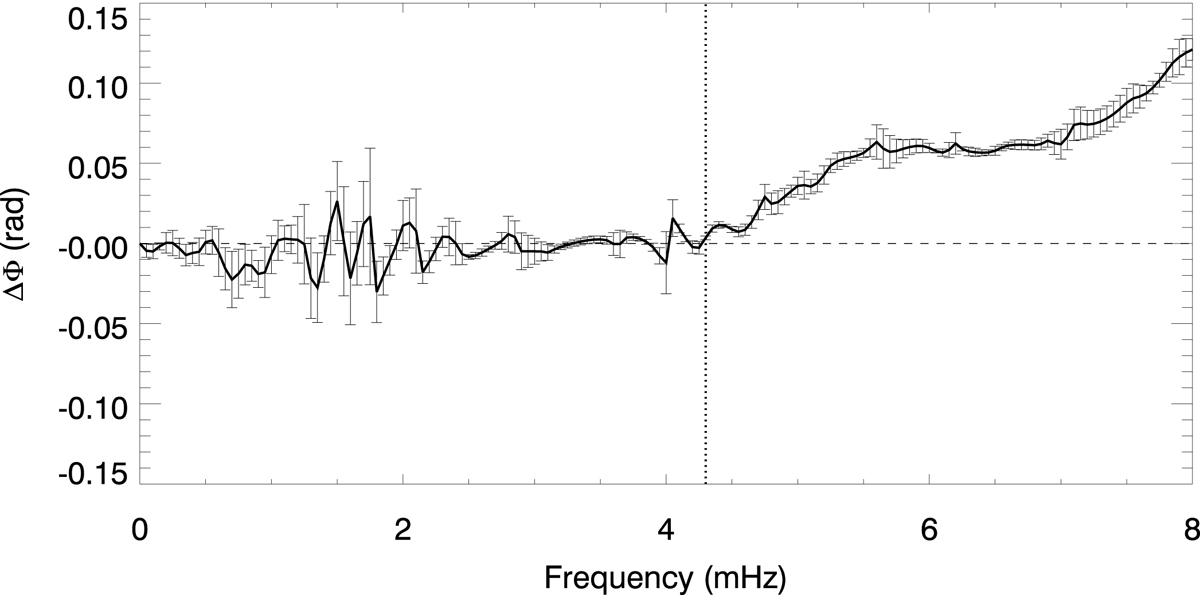
Average phase-difference spectra between the vertical velocity signal at z = 880 km and z = 900 km measured from the simulation of the VALC model with a vertical magnetic field of 130 G. A positive phase difference indicates upward wave propagation. Error bars show the standard deviation of the averaged data. The vertical dotted line marks the value of the cutoff frequency as determined from examining the phase spectra.
Current usage metrics show cumulative count of Article Views (full-text article views including HTML views, PDF and ePub downloads, according to the available data) and Abstracts Views on Vision4Press platform.
Data correspond to usage on the plateform after 2015. The current usage metrics is available 48-96 hours after online publication and is updated daily on week days.
Initial download of the metrics may take a while.