Fig. 1.
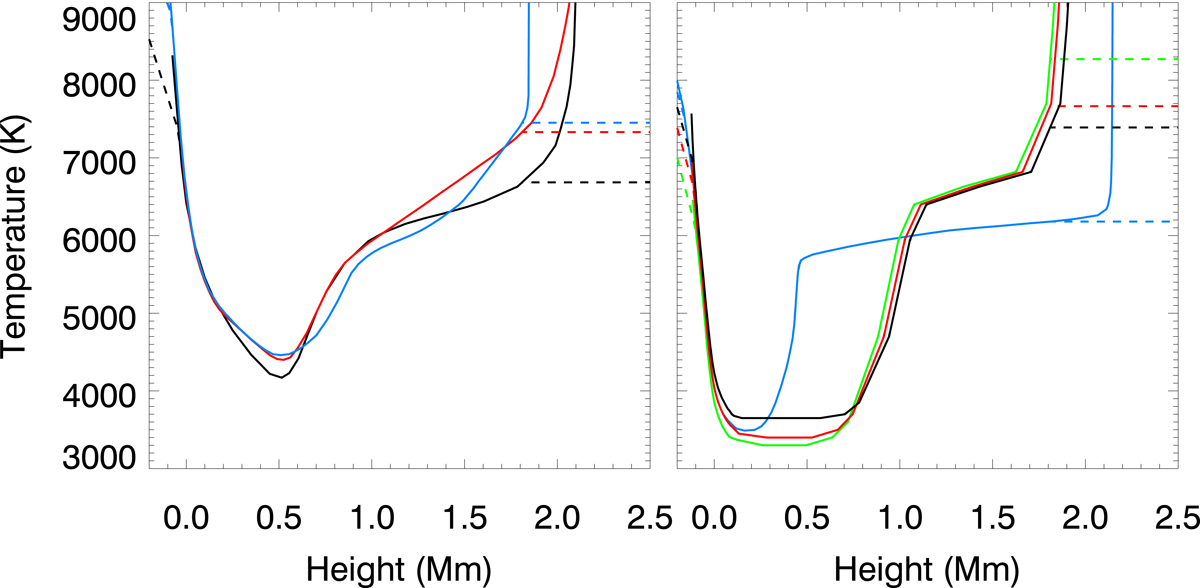
Temperature stratification of the solar models. Left panel: quiet-Sun temperature distribution as given by the VALC (black line), FALC (red line), and Avrett2015QS (blue line) models. Right panel: sunspot temperature stratification from eMaltby (green line), mMaltby (red line), lMaltby (black line), and Avrett2015spot (blue line) atmospheres. In both panels, the solid lines represent the original models and dashed lines correspond to the temperature profiles we employed to compute the numerical simulations.
Current usage metrics show cumulative count of Article Views (full-text article views including HTML views, PDF and ePub downloads, according to the available data) and Abstracts Views on Vision4Press platform.
Data correspond to usage on the plateform after 2015. The current usage metrics is available 48-96 hours after online publication and is updated daily on week days.
Initial download of the metrics may take a while.