Fig. 6.
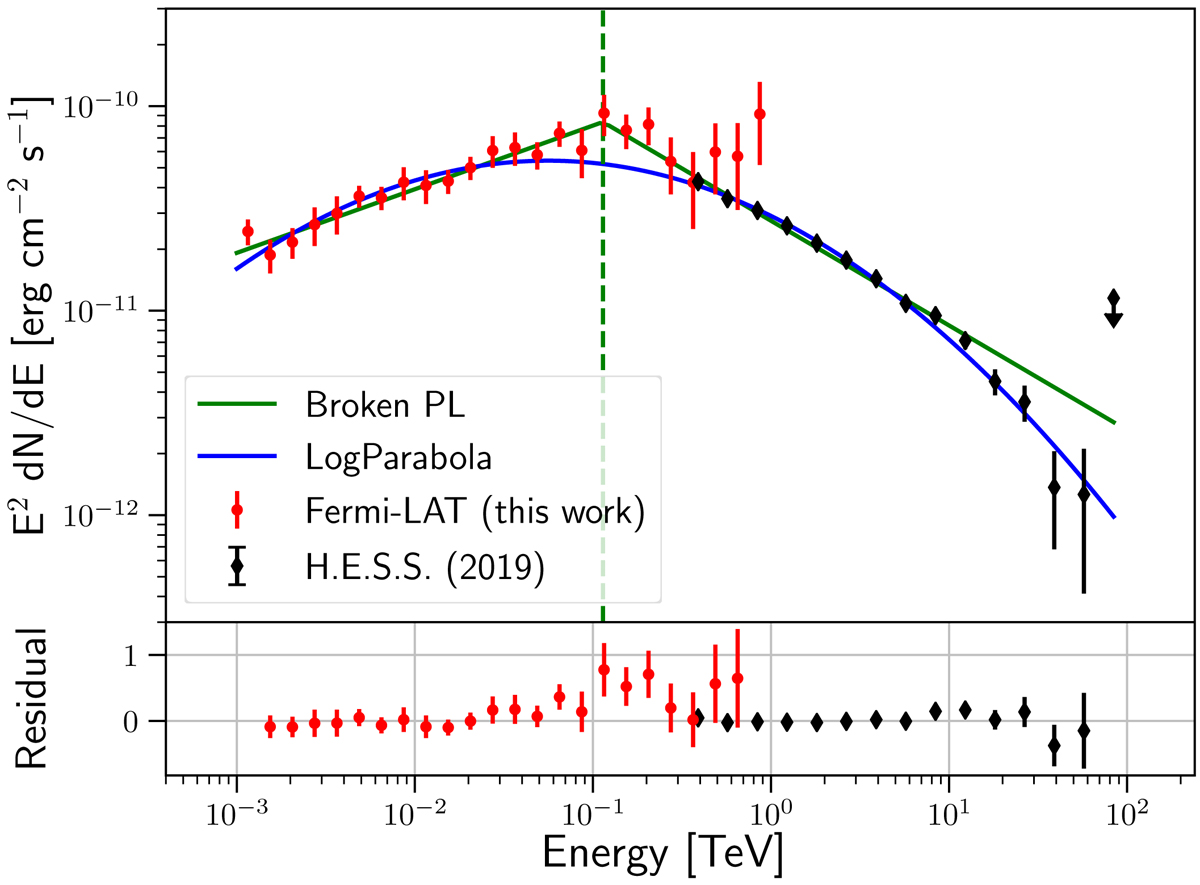
Combined spectra of the PWN HESS J1825-137 with the spectral measurements obtained in this work (red points) using 11.6 years of Fermi-LAT data from 1 GeV to 1 TeV and the H.E.S.S. results for the 100 GeV–90 TeV energy range (black points). The Fermi-LAT flux points were obtained doing a spectral analysis in the various energy bands with their relative spatial model. The combined SED has been fitted with both a LogParabola (blue line) and a Broken PL (green line). The vertical line corresponds to the energy break Eb of the Broken PL model. The bottom panel shows the normalised residual between the data and the LogParabola model.
Current usage metrics show cumulative count of Article Views (full-text article views including HTML views, PDF and ePub downloads, according to the available data) and Abstracts Views on Vision4Press platform.
Data correspond to usage on the plateform after 2015. The current usage metrics is available 48-96 hours after online publication and is updated daily on week days.
Initial download of the metrics may take a while.