Fig. 3.
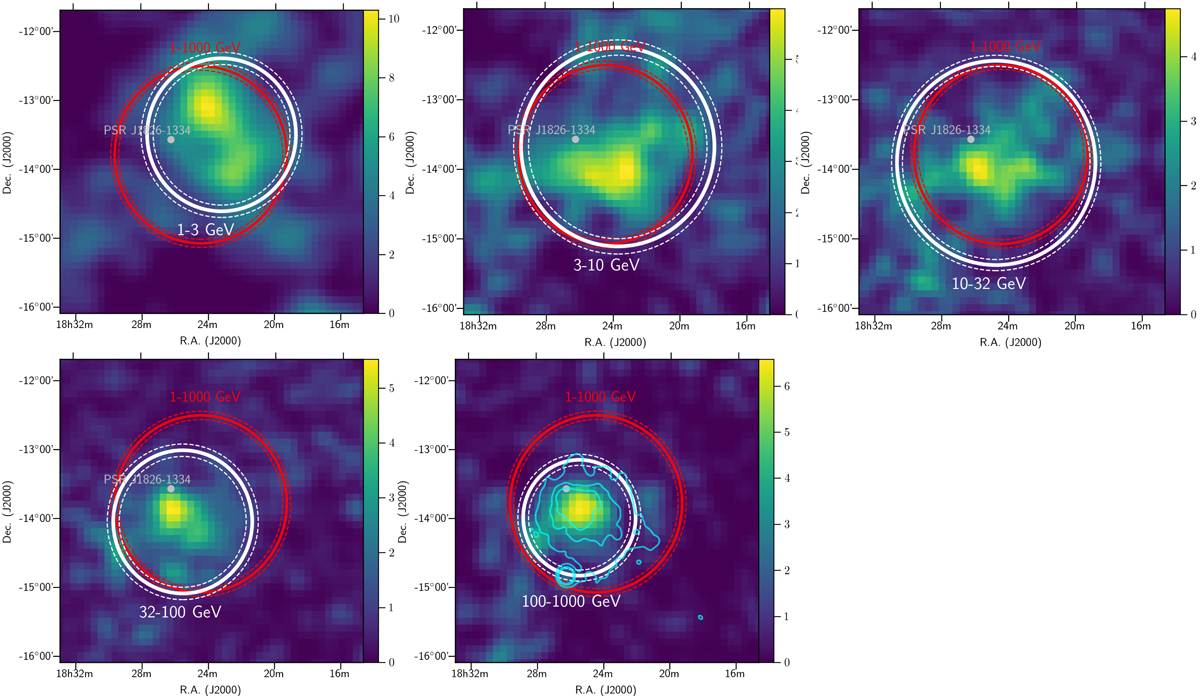
TS maps (in sigma units), in celestial coordinates, of the region around HESS J1825-137 for the energy bands: 1–3 GeV (top left), 3–10 GeV (top centre), 10–32 GeV (top right), 32–100 GeV (bottom left) and 100 GeV–1 TeV (bottom right). The TS maps are smoothed with a Gaussian of radius 0.1°. The white circles represent the extension (solid line) and its statistical uncertainty (dashed lines) determined in the respective energy band. For comparison, the resulting extension obtained for the entire energy range (1 GeV–1 TeV) is overlaid with a red line. All extensions shown correspond to the 68% containment radius. In the 100 GeV–1 TeV (bottom right) plot, H.E.S.S. significance contours at 5, 10, and 15σ, for energies below 1 TeV (H.E.S.S. Collaboration 2019), are shown with light-blue lines for comparison. The H.E.S.S. contour also includes the excess of the nearby LS 5039 source (small circular excess at the southern boarder of the PWN).
Current usage metrics show cumulative count of Article Views (full-text article views including HTML views, PDF and ePub downloads, according to the available data) and Abstracts Views on Vision4Press platform.
Data correspond to usage on the plateform after 2015. The current usage metrics is available 48-96 hours after online publication and is updated daily on week days.
Initial download of the metrics may take a while.