Open Access
Fig. 7
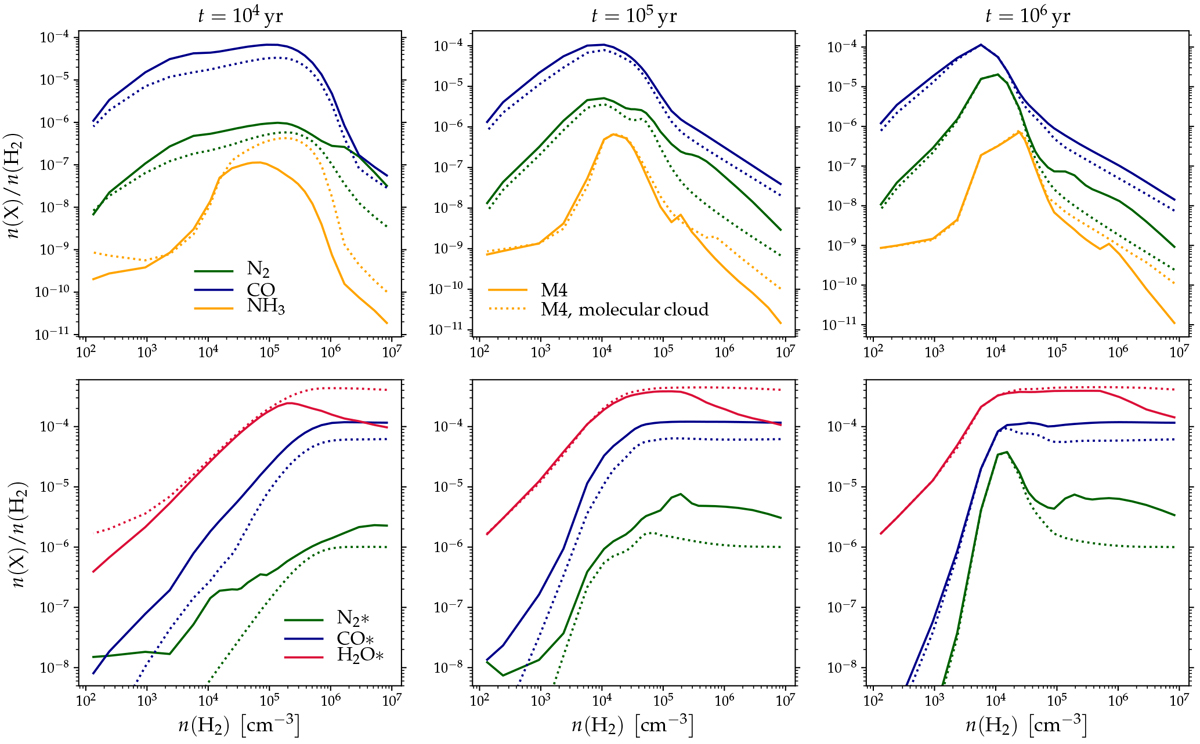
As shown in Fig. 5, but in this figure indicating results from model M4 (solid lines) and model M4 with low-density cloud initial conditions (dotted lines). The time runs from the beginning of stage 2 (see main text).
Current usage metrics show cumulative count of Article Views (full-text article views including HTML views, PDF and ePub downloads, according to the available data) and Abstracts Views on Vision4Press platform.
Data correspond to usage on the plateform after 2015. The current usage metrics is available 48-96 hours after online publication and is updated daily on week days.
Initial download of the metrics may take a while.