Fig. 6
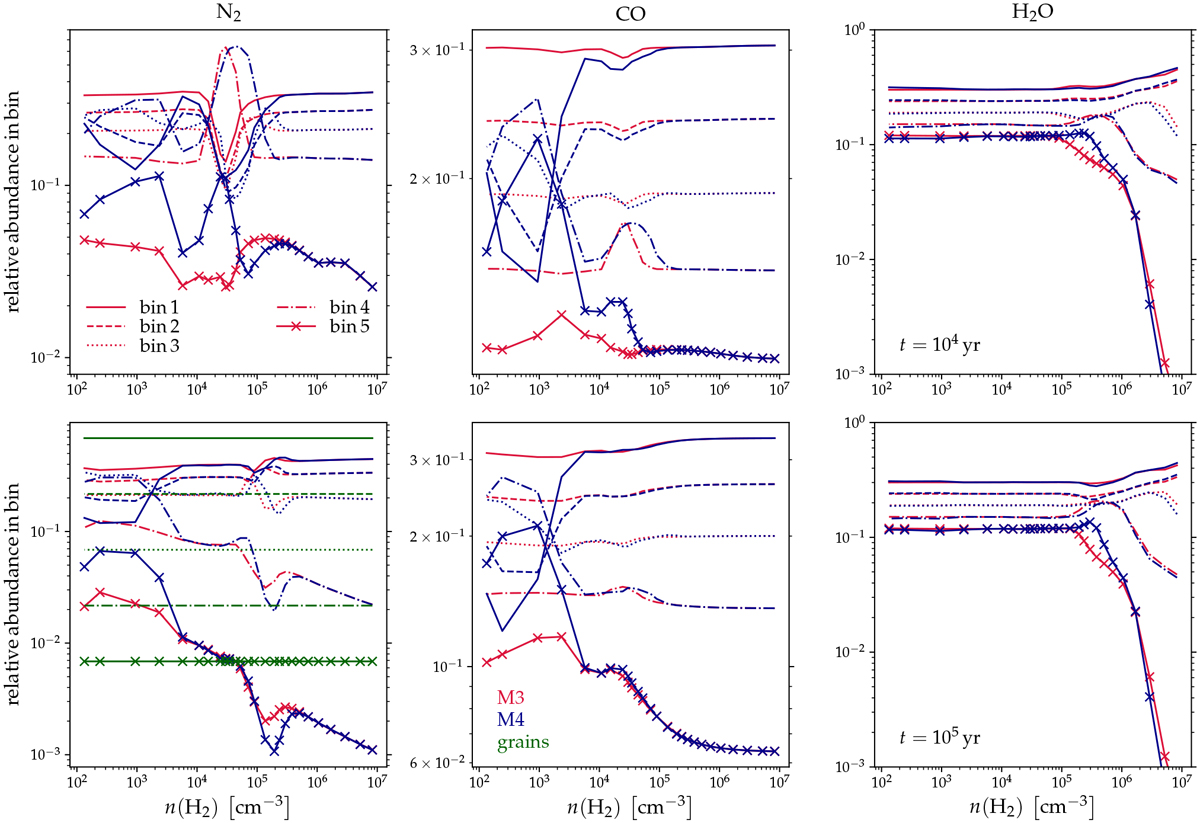
Relative abundances in each grain size bin as functions of density in the L1544 model at t = 104 yr (top) and at t = 105 yr (bottom). The red lines correspond to model M3, while the blue lines correspond to model M4. The green lines show the relative abundance of the grains in each bin, shown only in the bottom left panel for clarity (but note that the y-axis scaling is different in each subplot). The effective grain radius increases with bin label.
Current usage metrics show cumulative count of Article Views (full-text article views including HTML views, PDF and ePub downloads, according to the available data) and Abstracts Views on Vision4Press platform.
Data correspond to usage on the plateform after 2015. The current usage metrics is available 48-96 hours after online publication and is updated daily on week days.
Initial download of the metrics may take a while.