Fig. 5
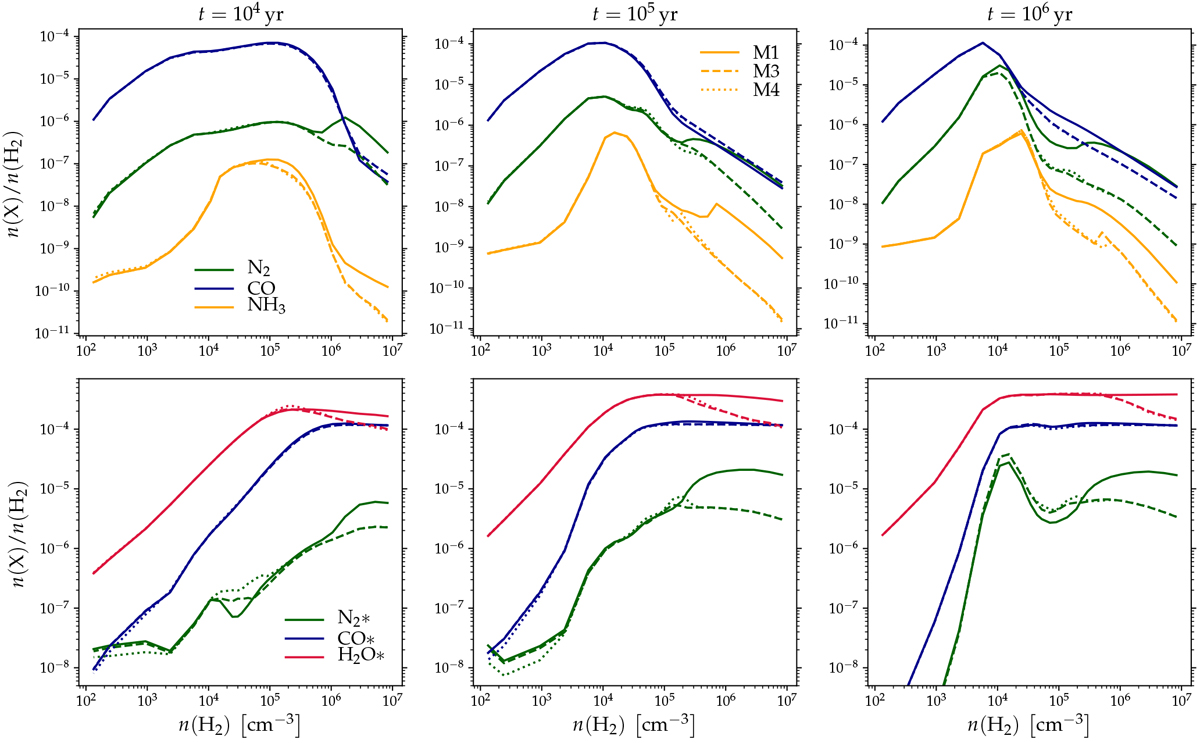
Abundances of selected gas-phase species (top row) and grain-surface species (labeled with asterisks; bottom row) as functions of medium density in the L1544 model. The abundances are displayed at three distinct time steps, ranging from 104 yr (left) to 106 yr (right). The different line styles correspond to model M1 (solid lines), model M3 (dashed lines), and model M4 (dotted lines). The ice abundances represent sums over all populations in models M3 and M4.
Current usage metrics show cumulative count of Article Views (full-text article views including HTML views, PDF and ePub downloads, according to the available data) and Abstracts Views on Vision4Press platform.
Data correspond to usage on the plateform after 2015. The current usage metrics is available 48-96 hours after online publication and is updated daily on week days.
Initial download of the metrics may take a while.