Fig. 4
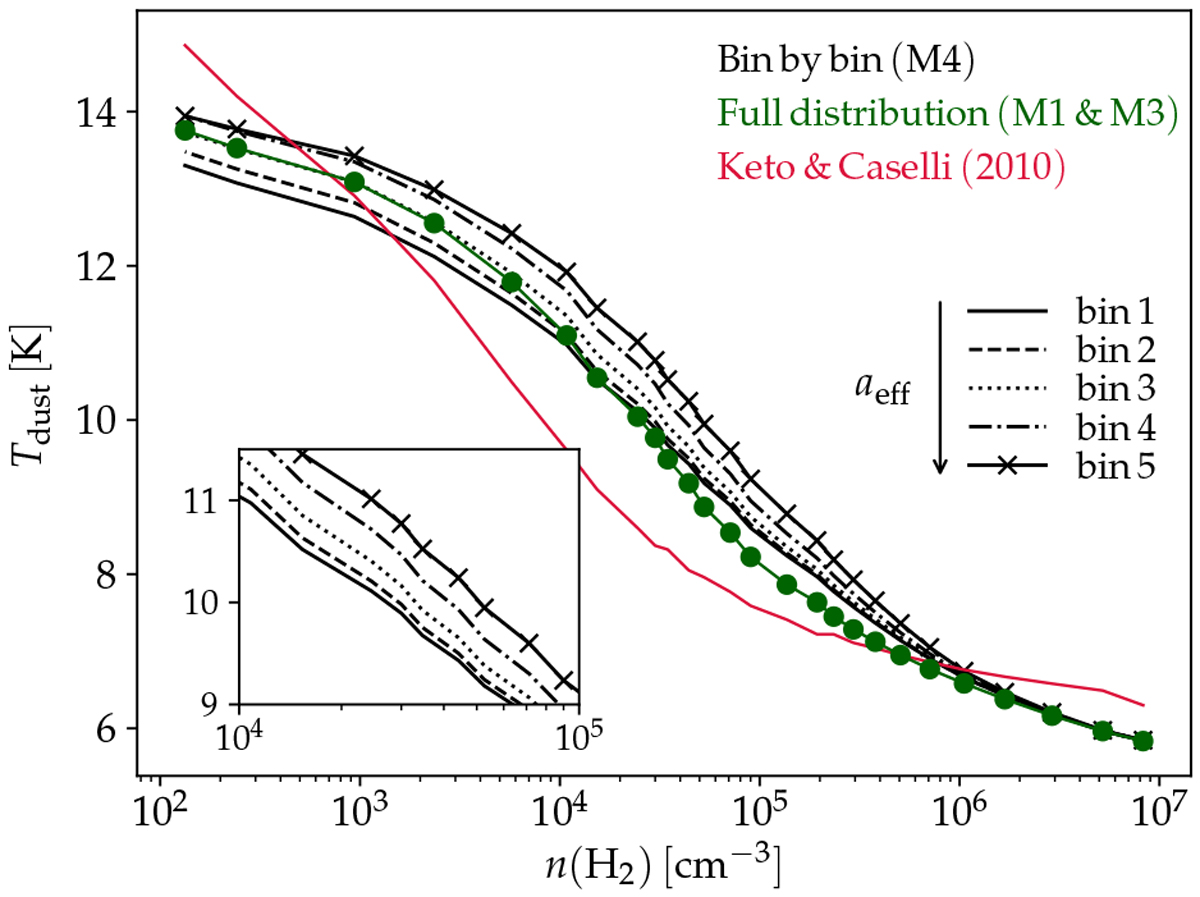
Equilibrium dust temperature profiles as a function of density, calculated for the five distinct grain populations (black lines; model M4) or over the entire distribution (green; models M1 and M3). The effective grain radius increases with bin label as indicated in the plot. The red line shows the Tdust profile from Keto & Caselli (2010). The inset shows a zoom-in of the n(H2) = 104 cm−3 to n(H2) = 105 cm−3 density regime, excluding the result for the full distribution.
Current usage metrics show cumulative count of Article Views (full-text article views including HTML views, PDF and ePub downloads, according to the available data) and Abstracts Views on Vision4Press platform.
Data correspond to usage on the plateform after 2015. The current usage metrics is available 48-96 hours after online publication and is updated daily on week days.
Initial download of the metrics may take a while.