Fig. 3
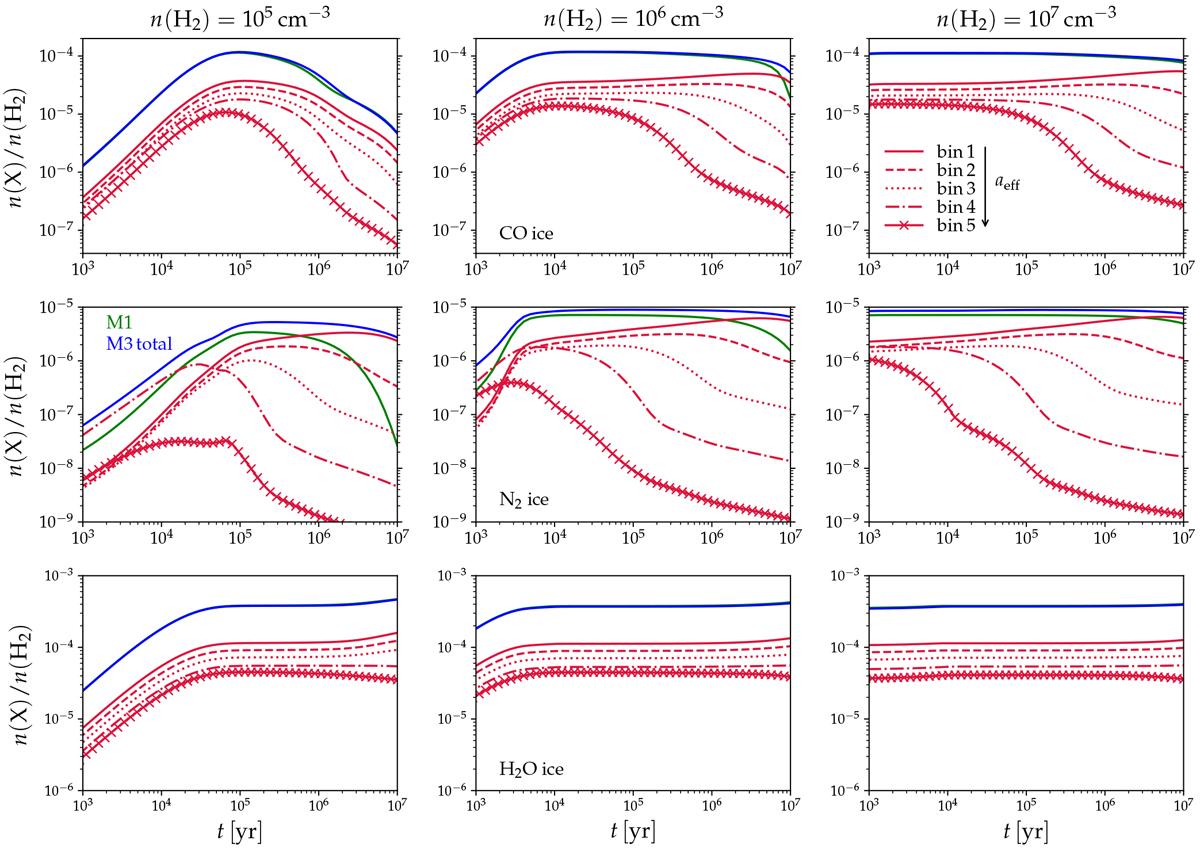
Distributions of CO (top row), N2 (middle row), and H2O (bottom row) ice as functions of time at three different medium densities. The green solid lines correspond to model M1. The red andblue lines correspond to model M3; the red lines represent the abundances on each grain population, while the blue line represents the sum over the individual grain populations. The green and blue lines overlap almost perfectly for H2O ice. The effective grain radius increases with bin label as indicated in the top right panel.
Current usage metrics show cumulative count of Article Views (full-text article views including HTML views, PDF and ePub downloads, according to the available data) and Abstracts Views on Vision4Press platform.
Data correspond to usage on the plateform after 2015. The current usage metrics is available 48-96 hours after online publication and is updated daily on week days.
Initial download of the metrics may take a while.