Fig. A.1
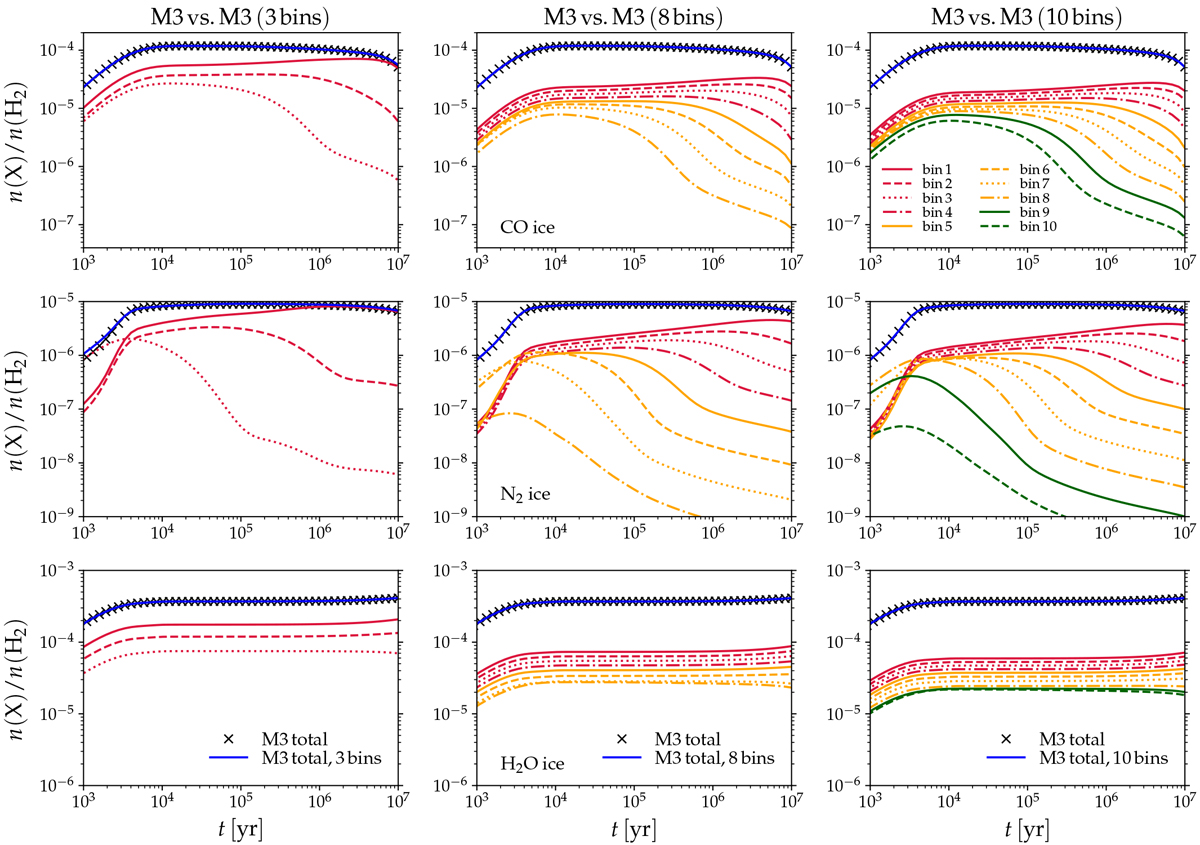
Distributions of CO (top row), N2 (middle row), and H2O (bottom row) ice as functions of time at a fixed medium density of n(H2) = 106 cm−3. Left, middle, and right panels: results for model M3 using 3, 8, or 10 grain size bins, respectively. The blue solid lines indicate the total ice abundance, while the black crosses indicate the corresponding total abundance in our fiducial M3 model. The red, orange, and green lines represent the breakdown of the total ice abundance in the grain size bins as shown in the top right panel. This breakdown is omitted for the fiducial M3 model for clarity.
Current usage metrics show cumulative count of Article Views (full-text article views including HTML views, PDF and ePub downloads, according to the available data) and Abstracts Views on Vision4Press platform.
Data correspond to usage on the plateform after 2015. The current usage metrics is available 48-96 hours after online publication and is updated daily on week days.
Initial download of the metrics may take a while.