Open Access
Fig. 1
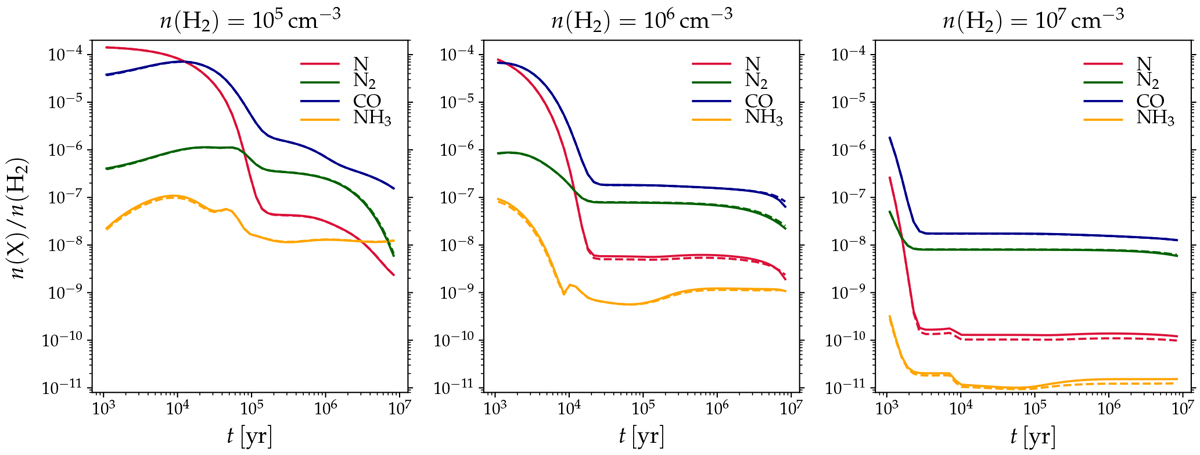
Abundances of selected gas-phase species, indicated in the figure, as a function of time for three medium densities. The solid lines correspond to model M1, while the dashed lines correspond to model M2.
Current usage metrics show cumulative count of Article Views (full-text article views including HTML views, PDF and ePub downloads, according to the available data) and Abstracts Views on Vision4Press platform.
Data correspond to usage on the plateform after 2015. The current usage metrics is available 48-96 hours after online publication and is updated daily on week days.
Initial download of the metrics may take a while.