Fig. A.2
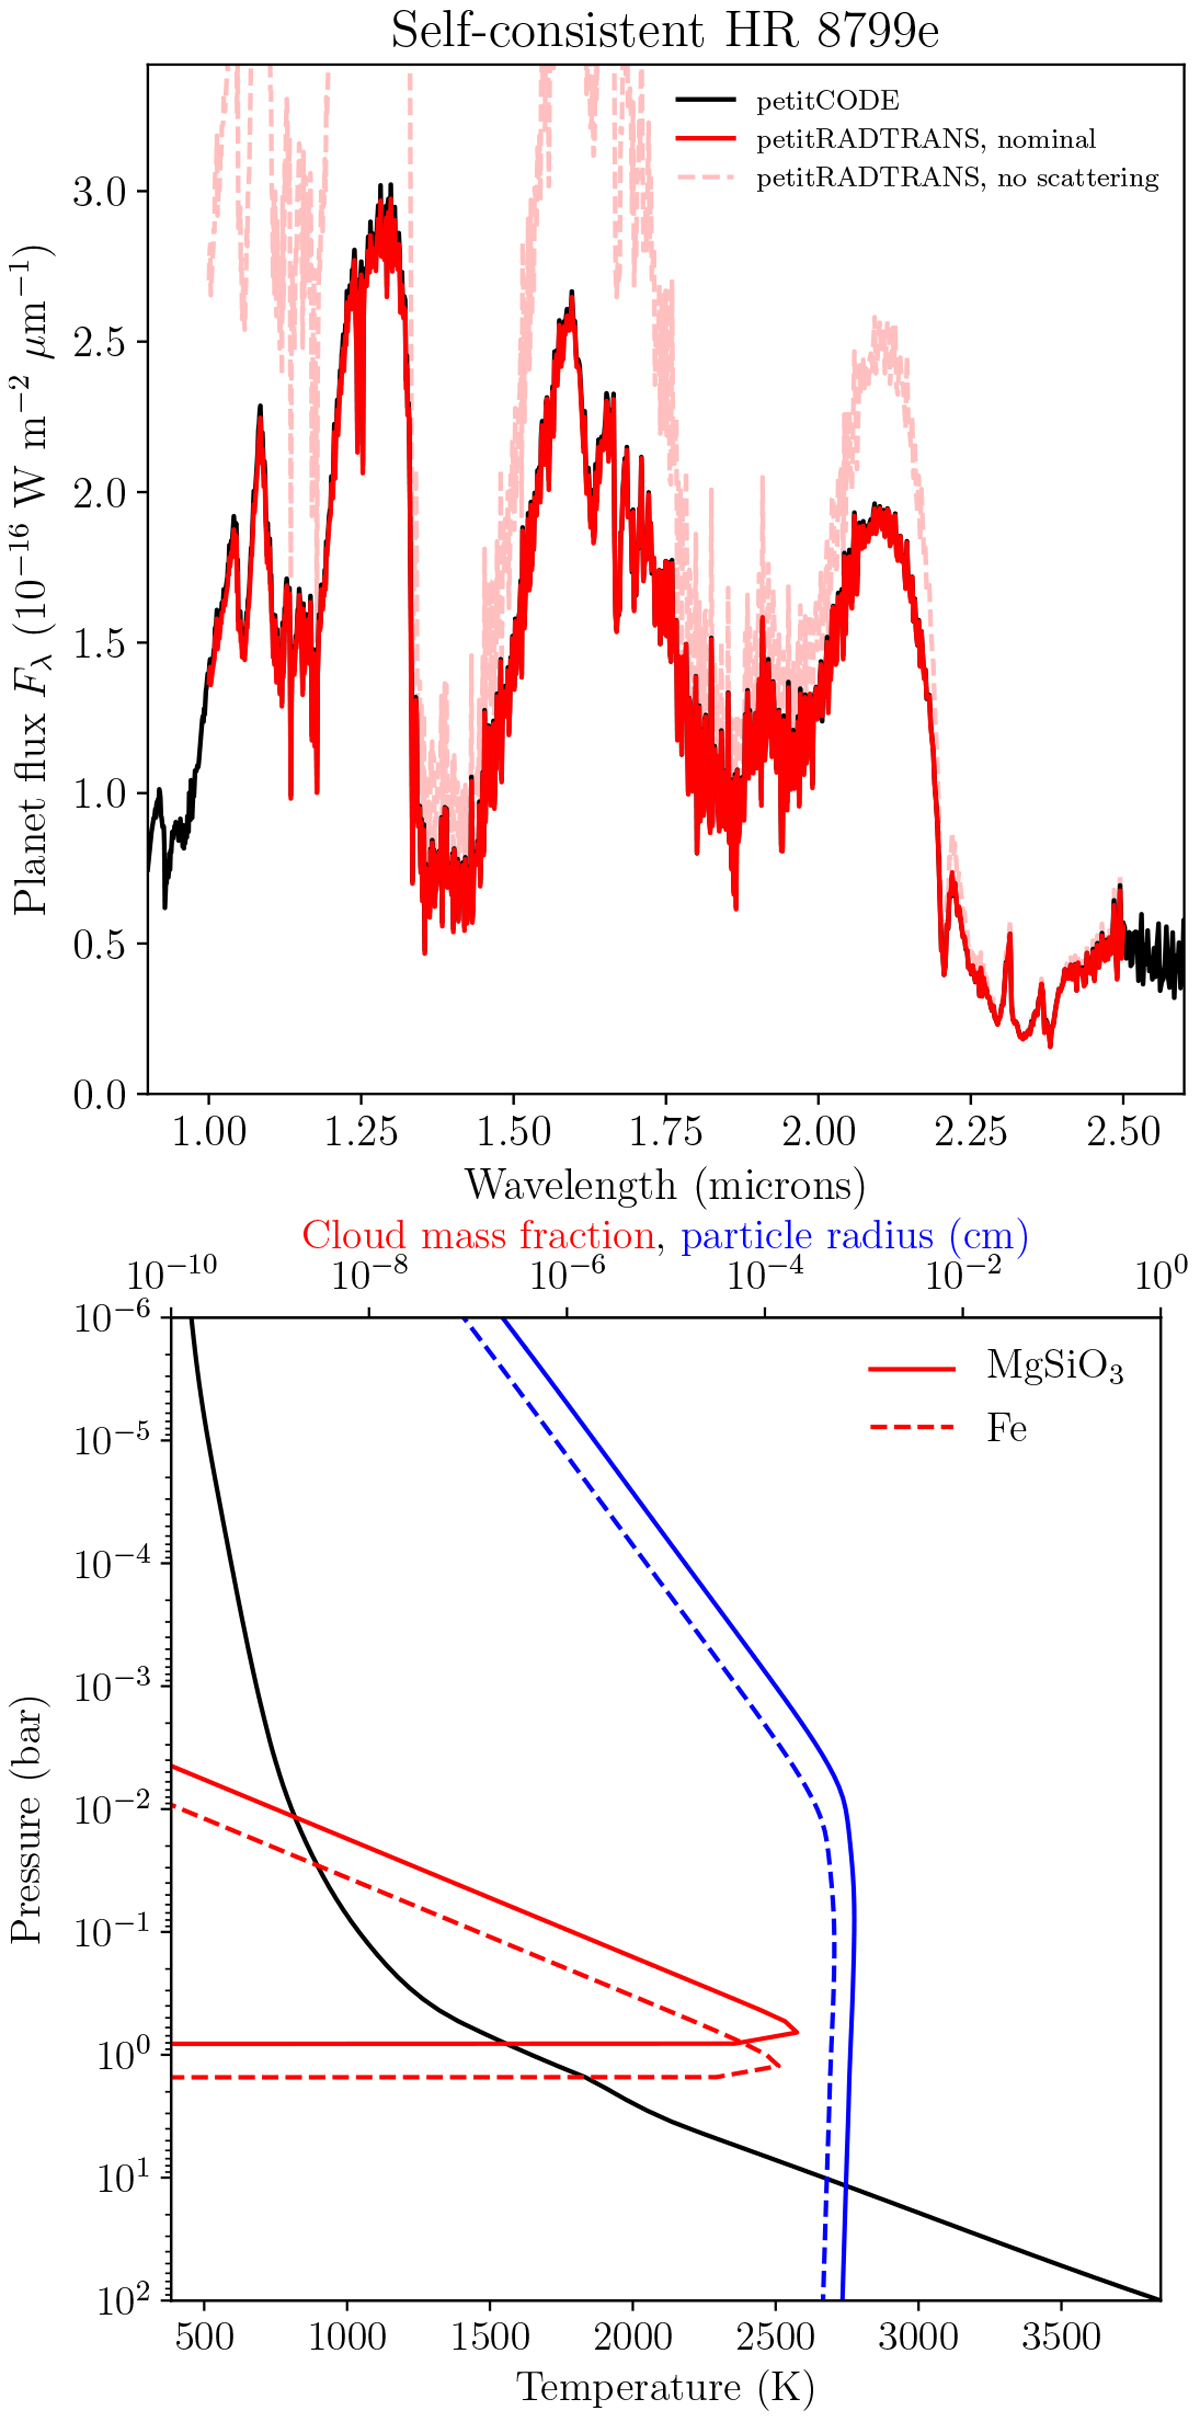
Upper panel: emission spectrum of a synthetic, self-consistent model of HR 8799e. The petitCODE calculation is shown as a black solid line, whereas the petitRADTRANS calculations, with and without scattering, are shown as red solid, and light red dashed lines, respectively. Lower panel: self-consistent atmospheric structure used for generating the spectra, showing the temperature (black solid line), cloud mass fractions (red lines), and cloud particle radii (blue lines) for MgSiO3 (solid lines) and Fe (dashed lines).
Current usage metrics show cumulative count of Article Views (full-text article views including HTML views, PDF and ePub downloads, according to the available data) and Abstracts Views on Vision4Press platform.
Data correspond to usage on the plateform after 2015. The current usage metrics is available 48-96 hours after online publication and is updated daily on week days.
Initial download of the metrics may take a while.