Fig. A.1
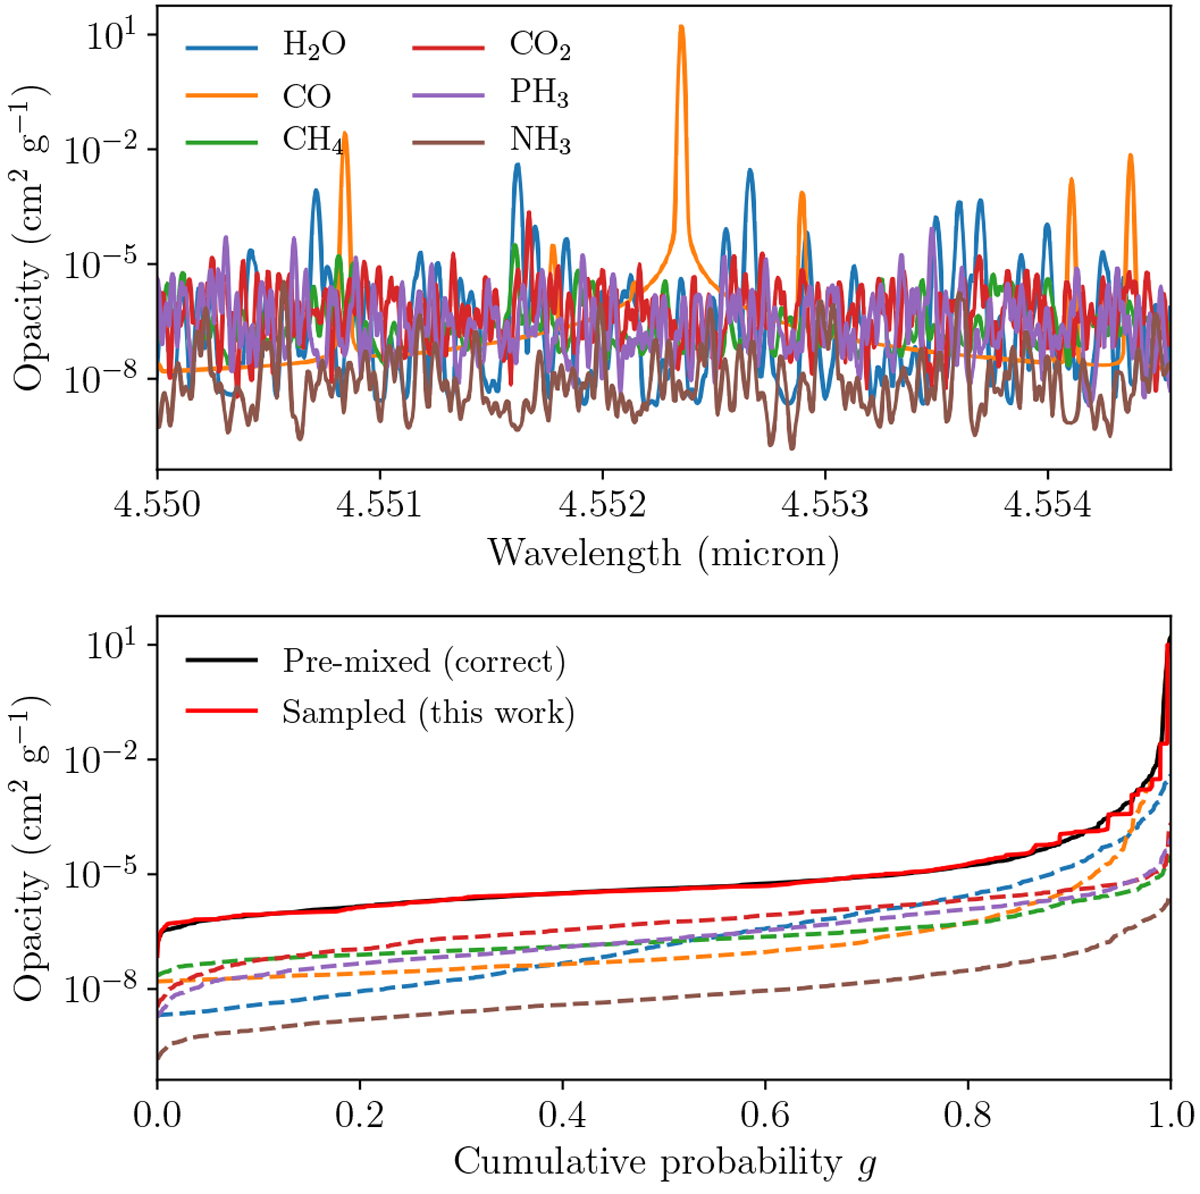
Upper panel: wavelength-dependent opacities of H2O, CO, CH4, CO2, PH3, and NH3, in the spectral range between 4.55 and 4.5545 micron. Lower panel: K-table curves of the individual species (dashed lines, same color coding as in the upper panel), the total k-table obtained from premixing the opacities of all species in wavelength space (black solid line), and total k-table obtained with the method used in this work (red solid line).
Current usage metrics show cumulative count of Article Views (full-text article views including HTML views, PDF and ePub downloads, according to the available data) and Abstracts Views on Vision4Press platform.
Data correspond to usage on the plateform after 2015. The current usage metrics is available 48-96 hours after online publication and is updated daily on week days.
Initial download of the metrics may take a while.