Fig. 3
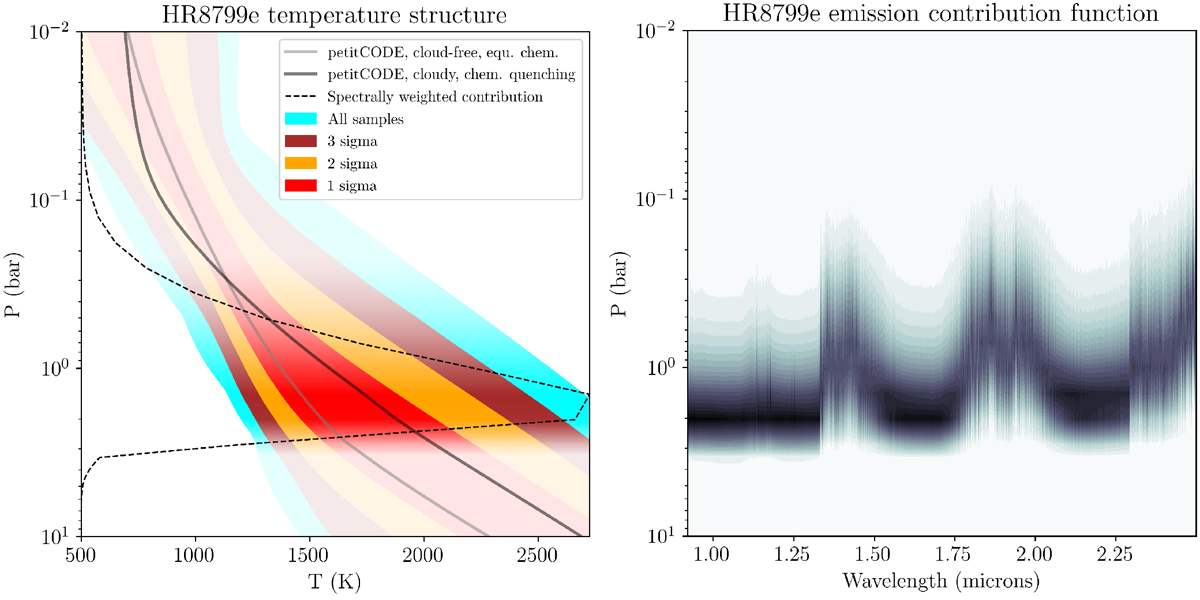
Left panel: temperature distribution of the atmosphere of HR 8799e, retrieved with the petitRADTRANS free retrieval setup. See the caption of Fig. 1 for an explanation of how to read this plot. In addition the self-consistent P-T curves derived from petitCODE, assuming chemical equilibrium and no clouds, or chemical quenching with clouds, are shown as gray and black solid lines, respectively. Right panel: emission contribution function of the best-fit model of the HR 8799e retrieval.
Current usage metrics show cumulative count of Article Views (full-text article views including HTML views, PDF and ePub downloads, according to the available data) and Abstracts Views on Vision4Press platform.
Data correspond to usage on the plateform after 2015. The current usage metrics is available 48-96 hours after online publication and is updated daily on week days.
Initial download of the metrics may take a while.