Fig. 1
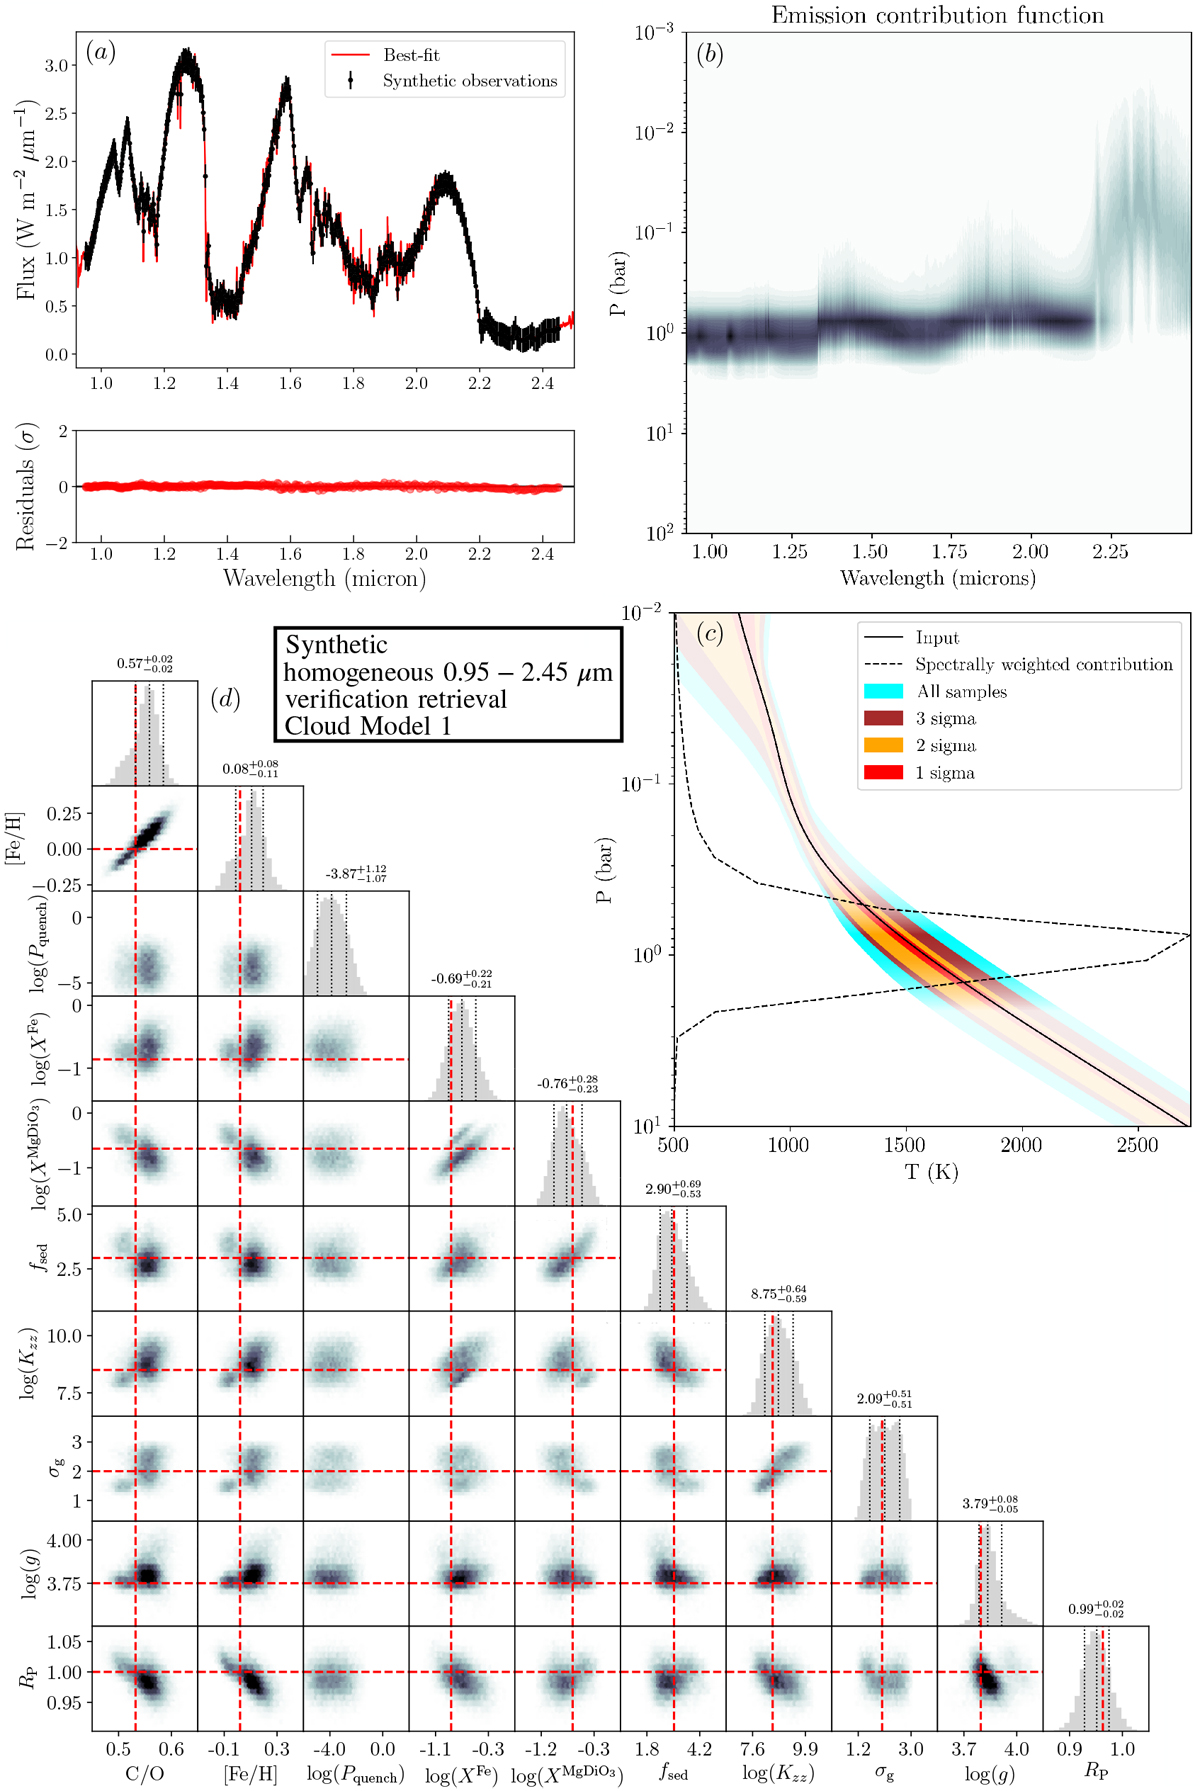
Results of the verification retrieval using Cloud model 1. Panel a: synthetic observation, best-fit spectrum and residuals. Panel b: emission contribution function. Due to the clouds, pressures larger than 1–2 bar cannot be probed. Panel c: retrieved pressure-temperature confidence envelopes. The black dashed line shows the flux average of the emission contribution function that is shown in panel b. The opaqueness of the temperature uncertainty envelopes has been scaled by this contribution function, with a minimum value of 10%. Panel d: 2d posterior plot of the (non-nuisance) retrieved atmospheric parameters. The red dashed lines denote the input values. The values of the cloud mass fractions at the cloud base have been divided by the mass fractions predicted when assuming equilibrium condensation at the cloud base location.
Current usage metrics show cumulative count of Article Views (full-text article views including HTML views, PDF and ePub downloads, according to the available data) and Abstracts Views on Vision4Press platform.
Data correspond to usage on the plateform after 2015. The current usage metrics is available 48-96 hours after online publication and is updated daily on week days.
Initial download of the metrics may take a while.