Fig. 10
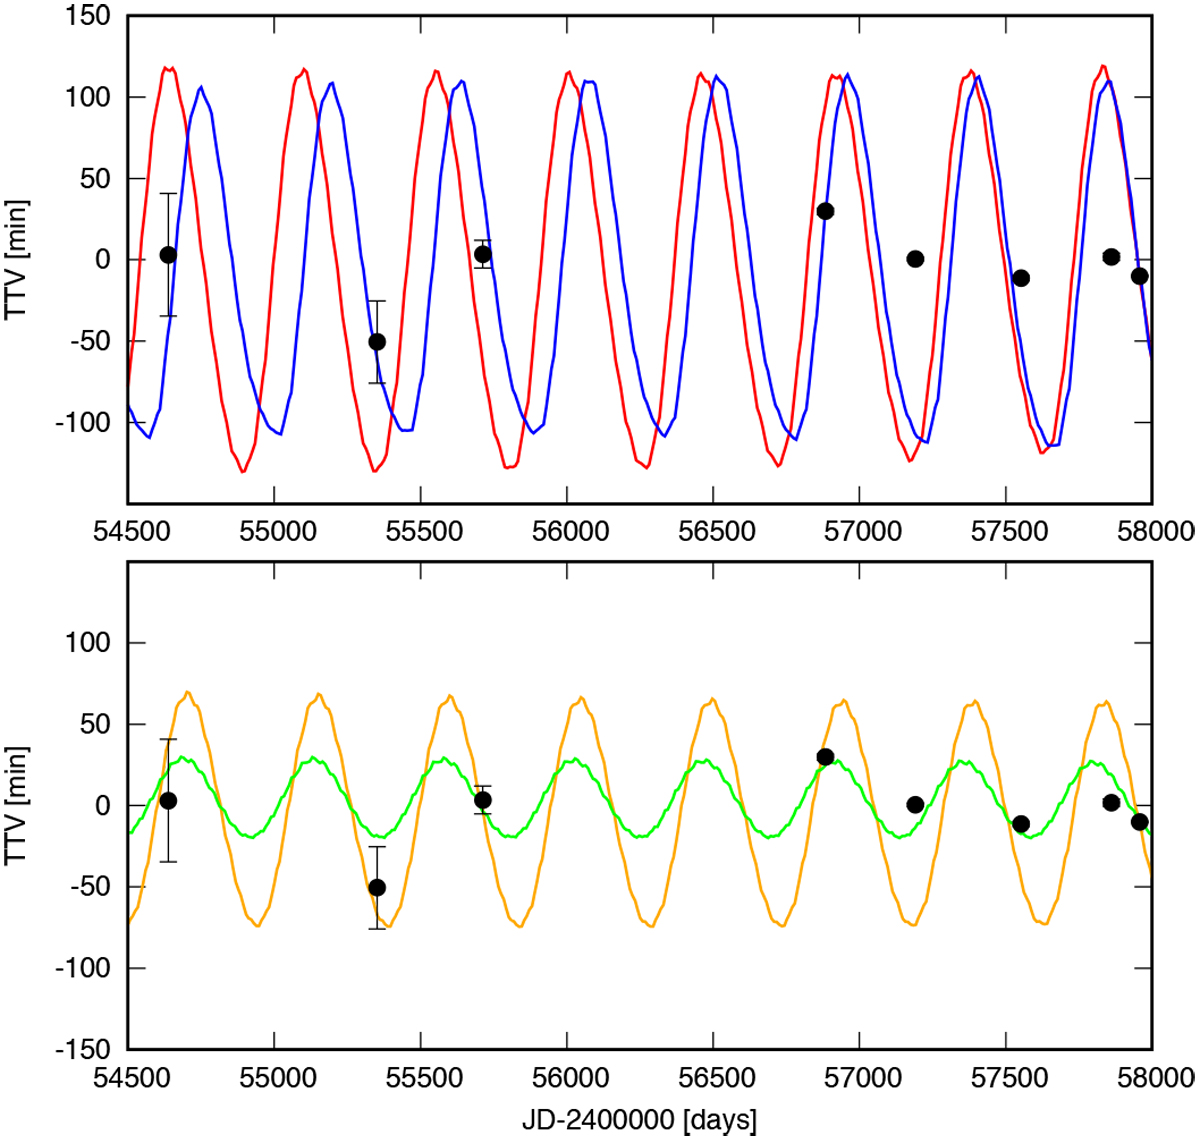
Transit-timing variations for the WASP-148b planet. In the upper panel, the curves correspond to numerical simulations for the solution shown in Table 6 with ic = 90°, Ωc = 0° (coplanar orbits, in red), or with ic = 60°, Ωc = 0° (mutual inclination I = 30°, in blue). The dots correspond to the observed TTVs (Table 3). For comparison, the lower panel presents curves corresponding to coplanar solutions with lower eccentricities, within our 95%-HDI: eb = 0.18, ec = 0.29 (in orange) or eb = 0.11, ec = 0.21 (in green).
Current usage metrics show cumulative count of Article Views (full-text article views including HTML views, PDF and ePub downloads, according to the available data) and Abstracts Views on Vision4Press platform.
Data correspond to usage on the plateform after 2015. The current usage metrics is available 48-96 hours after online publication and is updated daily on week days.
Initial download of the metrics may take a while.