Fig. 1
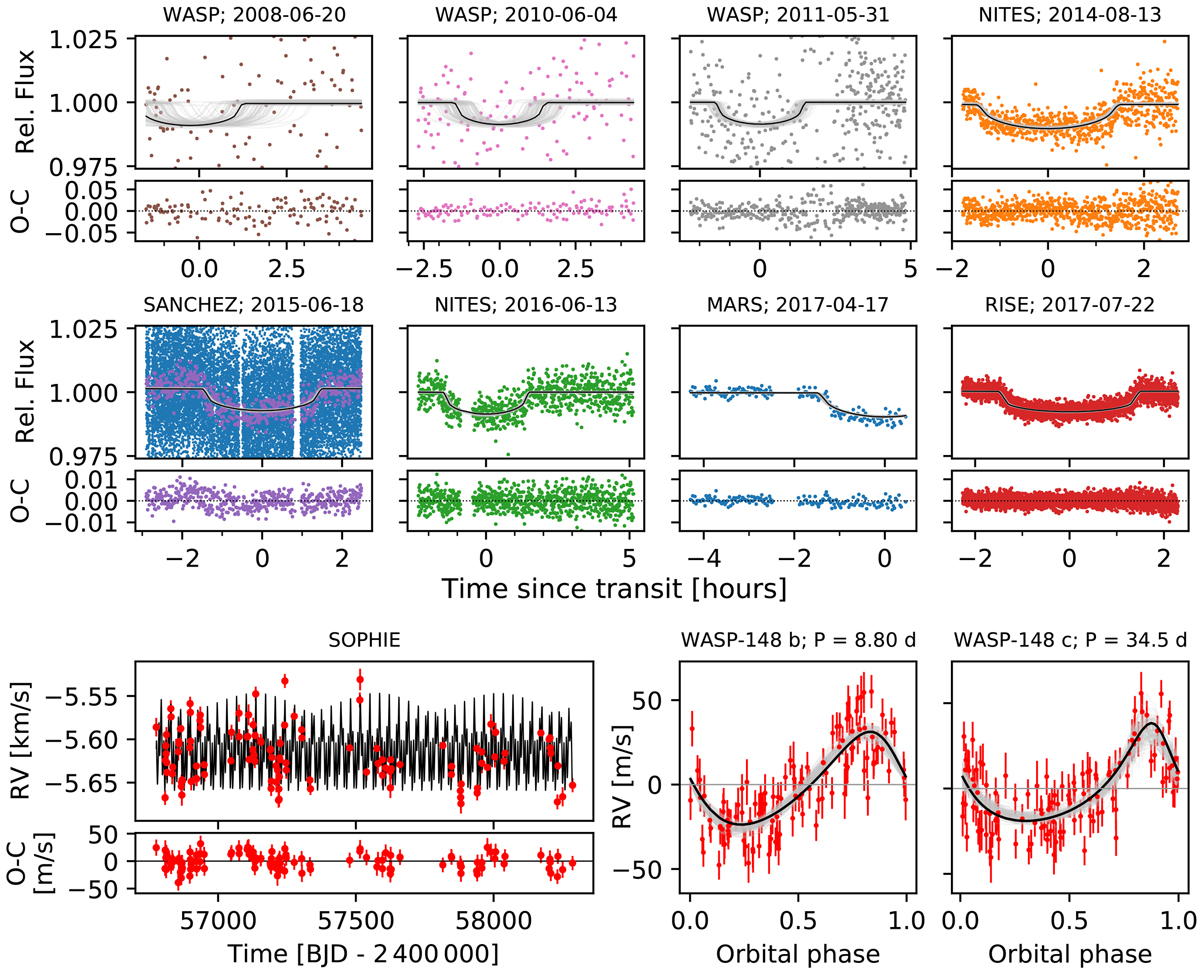
Photometric and RV observations of WASP-148, together with their two-planet Keplerian fit described in Sect. 5 (the parameters are reported in Table 6). The two upper panels show photometric transit dataof WASP-148 acquired by a series of observatories (see Table 3). The title of each panel shows the observatory name and observation date. The relative flux is provided for each transit. Below each panel, the residuals of the MAP model are shown. For the transit observed by the Sánchez telescope, we present the full dataset as blue empty circles, and a binned version as purple points. The lower set of panels shows the SOPHIE RVs and their 1σ error bars (Table 2). At left they are plotted as a function of time; the residuals to the MAP model are also plotted. The two panels at the right are the phase-folded RV curves for WASP-148b (P = 8.80 d) and WASP-148c (P = 34.5 d) after the effect of the other planet is removed. In the transit panels and the phase-folded RVs, the solid black curve is the MAP model, and the gray thin curves are 100 models drawn randomly from the posterior distribution (see Sect. 5).
Current usage metrics show cumulative count of Article Views (full-text article views including HTML views, PDF and ePub downloads, according to the available data) and Abstracts Views on Vision4Press platform.
Data correspond to usage on the plateform after 2015. The current usage metrics is available 48-96 hours after online publication and is updated daily on week days.
Initial download of the metrics may take a while.