Fig. 7
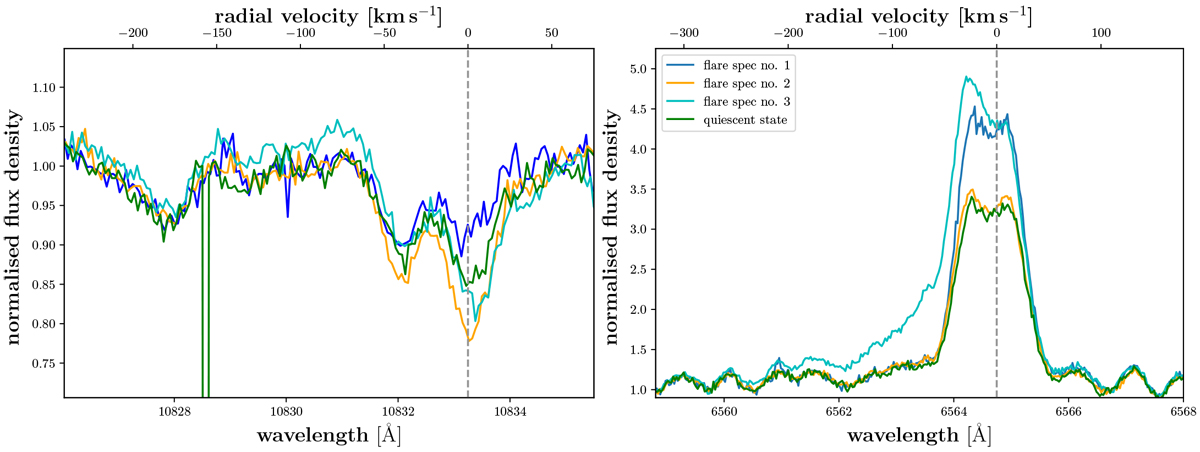
Four out of six available spectra for different chromospheric indicator lines for J07472+503. Left: He I IR line. Right: Hα line. The dashed vertical lines indicate the central wavelength of the displayed chromospheric lines. The same colours indicate spectra corresponding to the same observation date; the corresponding dates are given in Table 4. The emission wing of the blue spectrum is most clearly seen at around 10 831 Å. The green spectrum represents the most inactive state.
Current usage metrics show cumulative count of Article Views (full-text article views including HTML views, PDF and ePub downloads, according to the available data) and Abstracts Views on Vision4Press platform.
Data correspond to usage on the plateform after 2015. The current usage metrics is available 48-96 hours after online publication and is updated daily on week days.
Initial download of the metrics may take a while.