Fig. 6
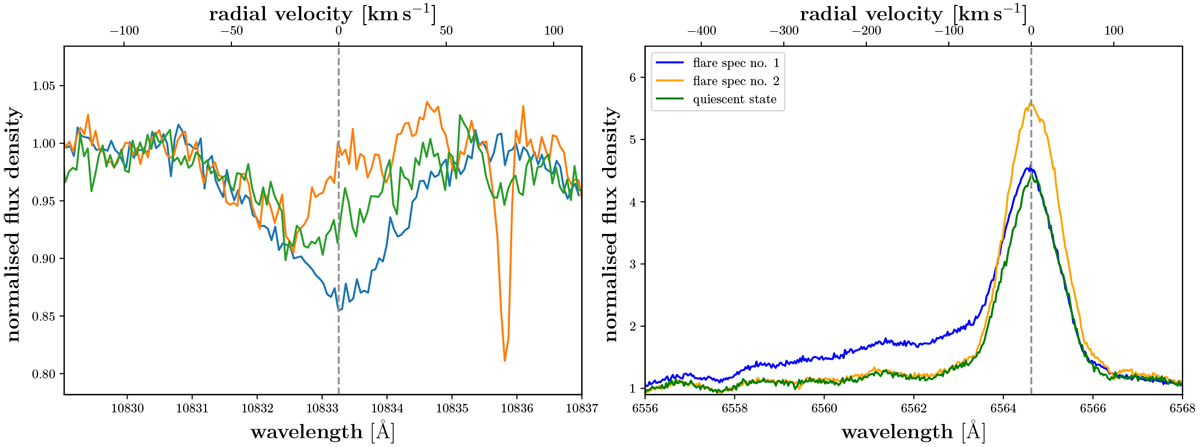
Three of 14 spectra for different chromospheric indicator lines for RBS 365. Left: He I IR line. Right: Hα line. The spectrum with the pronounced blue wing in Hα corresponds to the deepest spectrum in He I IR (both indicated by the blue solid line corresponding to flare spectrum no. 1). The green spectra represent the most quiescent case and the orange line a more active state (flare spectrum no. 2), which may or may not be associated with flaring. The dashed vertical lines denote the central wavelength of the displayed chromospheric lines.
Current usage metrics show cumulative count of Article Views (full-text article views including HTML views, PDF and ePub downloads, according to the available data) and Abstracts Views on Vision4Press platform.
Data correspond to usage on the plateform after 2015. The current usage metrics is available 48-96 hours after online publication and is updated daily on week days.
Initial download of the metrics may take a while.