Fig. 4
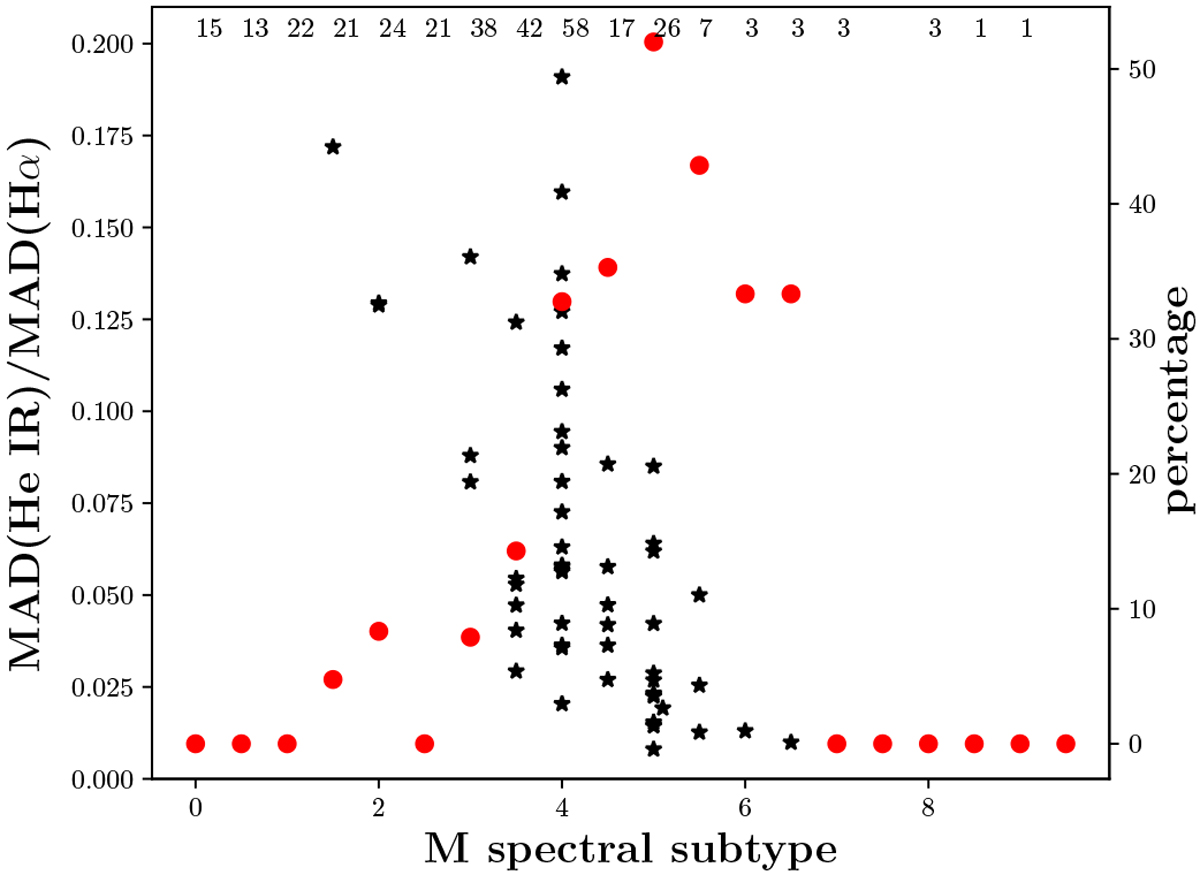
Median average deviation (He I)/MAD(Hα) as a function of spectral sub-type (black asterisks). The dots for the two M2.0 stars lie on top of each other. The red dots correspond to the right axis where we give the percentage of stars found to be variable. The total number of stars for each bin are given at the top of the panel.
Current usage metrics show cumulative count of Article Views (full-text article views including HTML views, PDF and ePub downloads, according to the available data) and Abstracts Views on Vision4Press platform.
Data correspond to usage on the plateform after 2015. The current usage metrics is available 48-96 hours after online publication and is updated daily on week days.
Initial download of the metrics may take a while.