Fig. 3
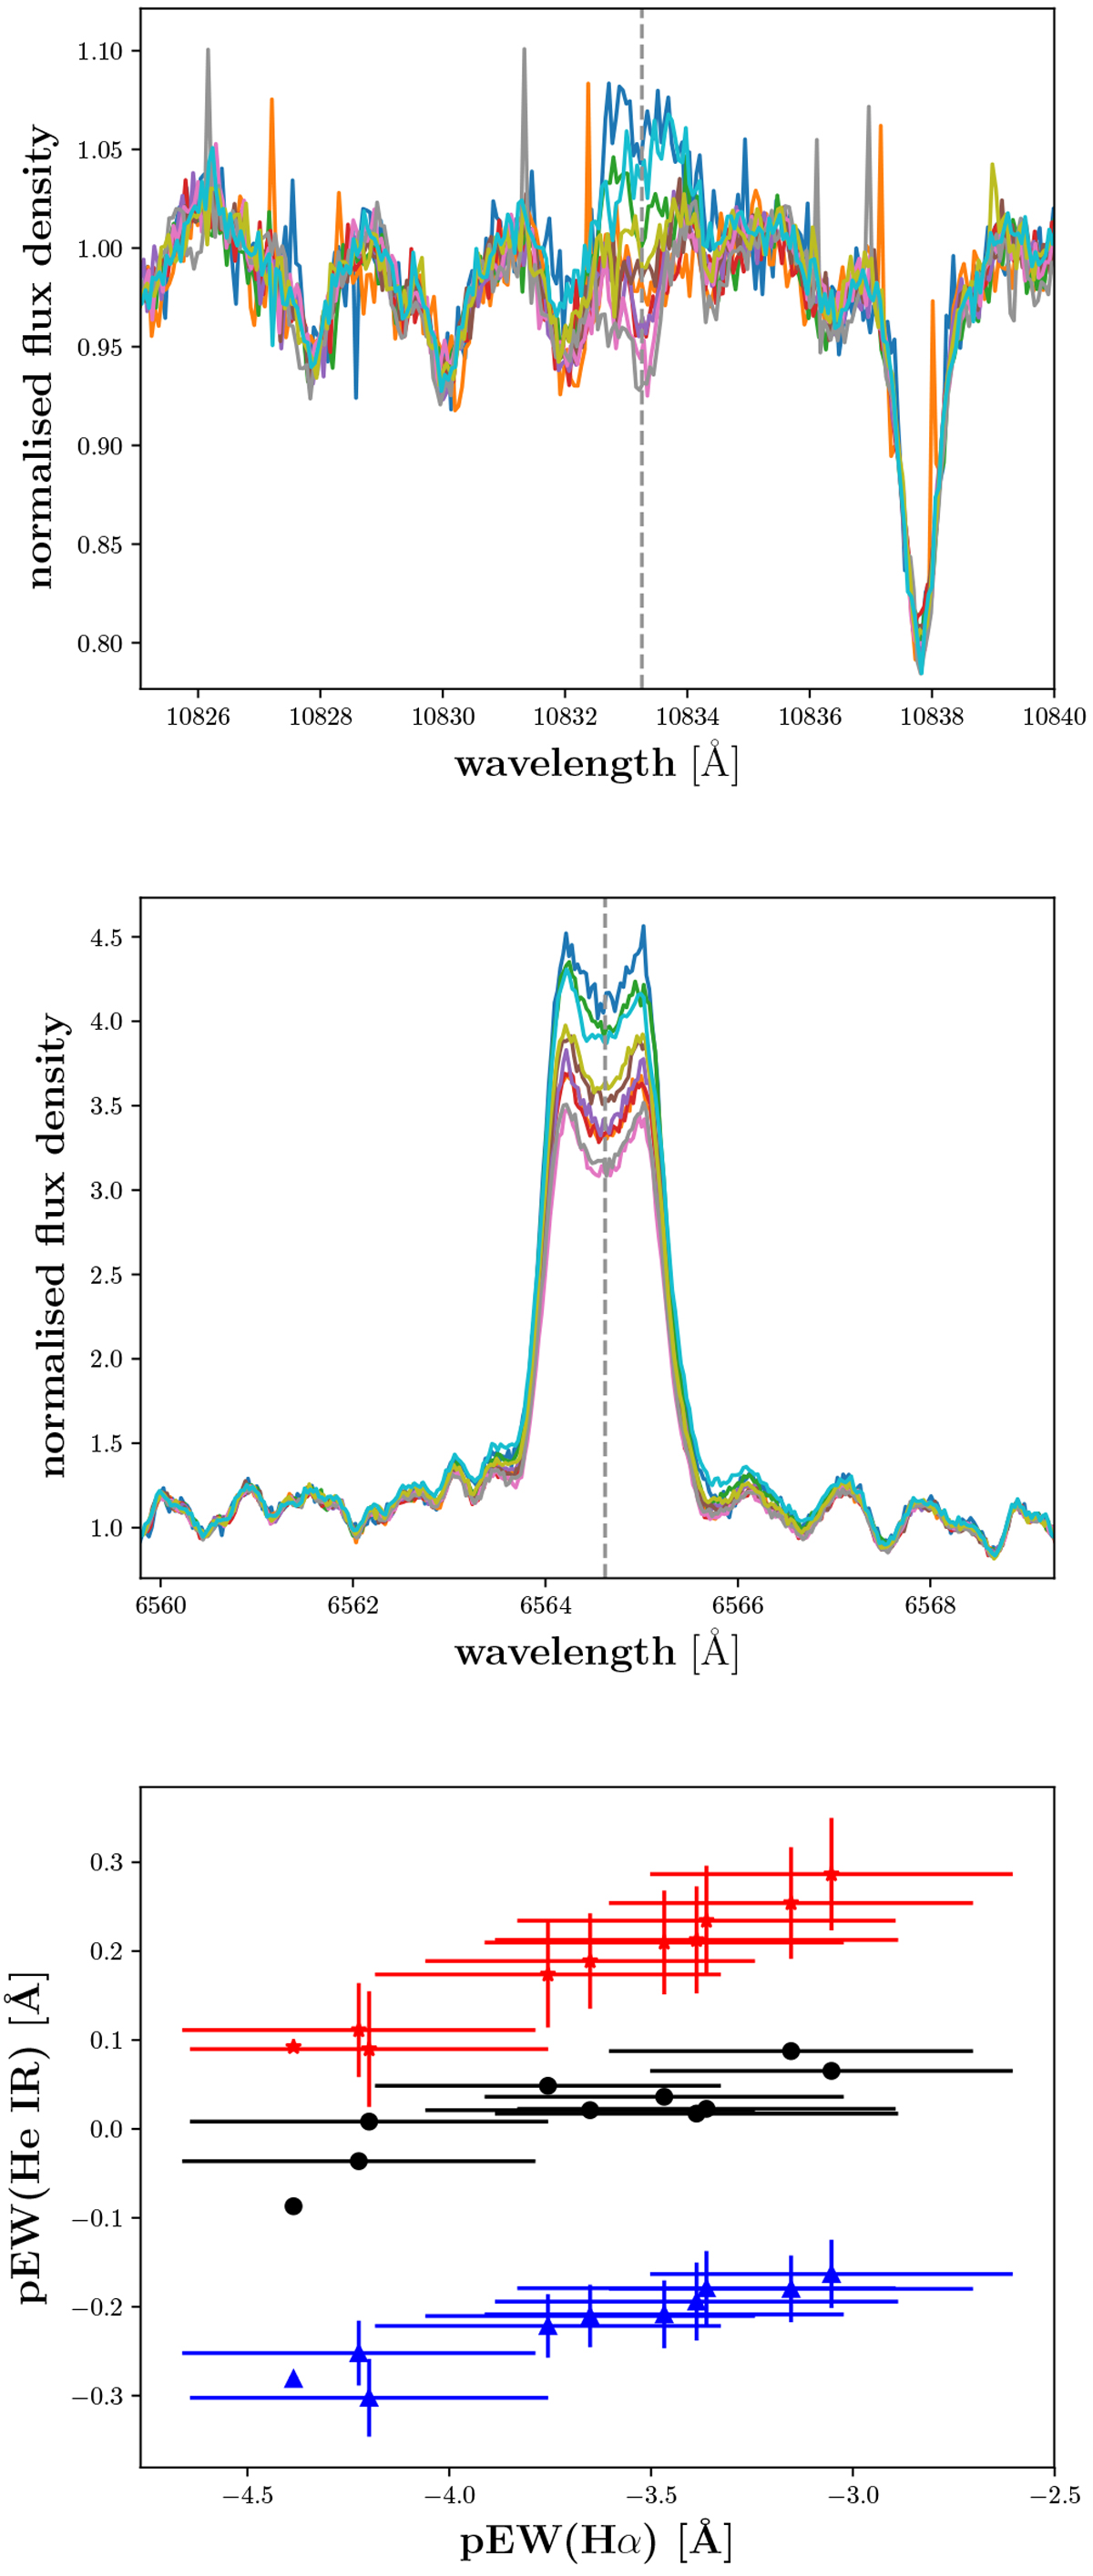
All available spectra of the star G 080-021. Top: region around the He I IR line. Middle: region around Hα. The dashed vertical lines indicate the central wavelength for the He I IR and the Hα lines, respectively. Bottom: correlations for different chromospheric lines to pEW(Hα); black denotepEW(He I IR), red pEW(He I D3) scaled by 0.5, and blue pEW(Ca II IRT1).
Current usage metrics show cumulative count of Article Views (full-text article views including HTML views, PDF and ePub downloads, according to the available data) and Abstracts Views on Vision4Press platform.
Data correspond to usage on the plateform after 2015. The current usage metrics is available 48-96 hours after online publication and is updated daily on week days.
Initial download of the metrics may take a while.