Fig. 2
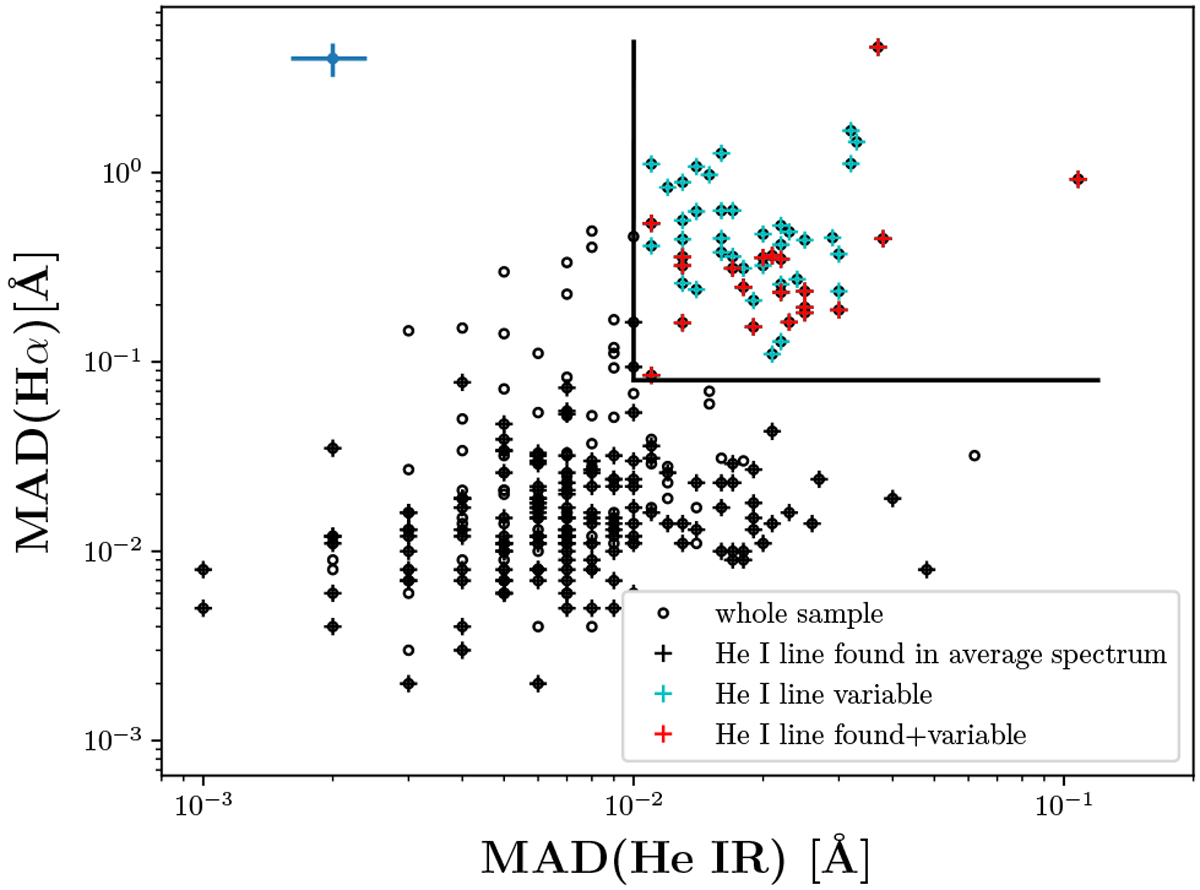
Median average deviation (Hα) as a function of MAD(He I IR) for the sample stars (black open circles). The black crosses indicate stars for which the He I IR line was detected in the averaged spectra by Fuhrmeister et al. (2019a). The cyan crosses indicate stars where the line could not be found in the average spectrum but is detectable by He I IR line variability, and the red crosses denote stars with both properties. The error bars shown at the top left corner illustrate the 20% systematic error estimated as described in Sect. 2.2. The black vertical and horizontal lines denote the thresholds for our conservativevariable He I IR line sample as defined in Sect. 3.2.
Current usage metrics show cumulative count of Article Views (full-text article views including HTML views, PDF and ePub downloads, according to the available data) and Abstracts Views on Vision4Press platform.
Data correspond to usage on the plateform after 2015. The current usage metrics is available 48-96 hours after online publication and is updated daily on week days.
Initial download of the metrics may take a while.