Free Access
Fig. 12
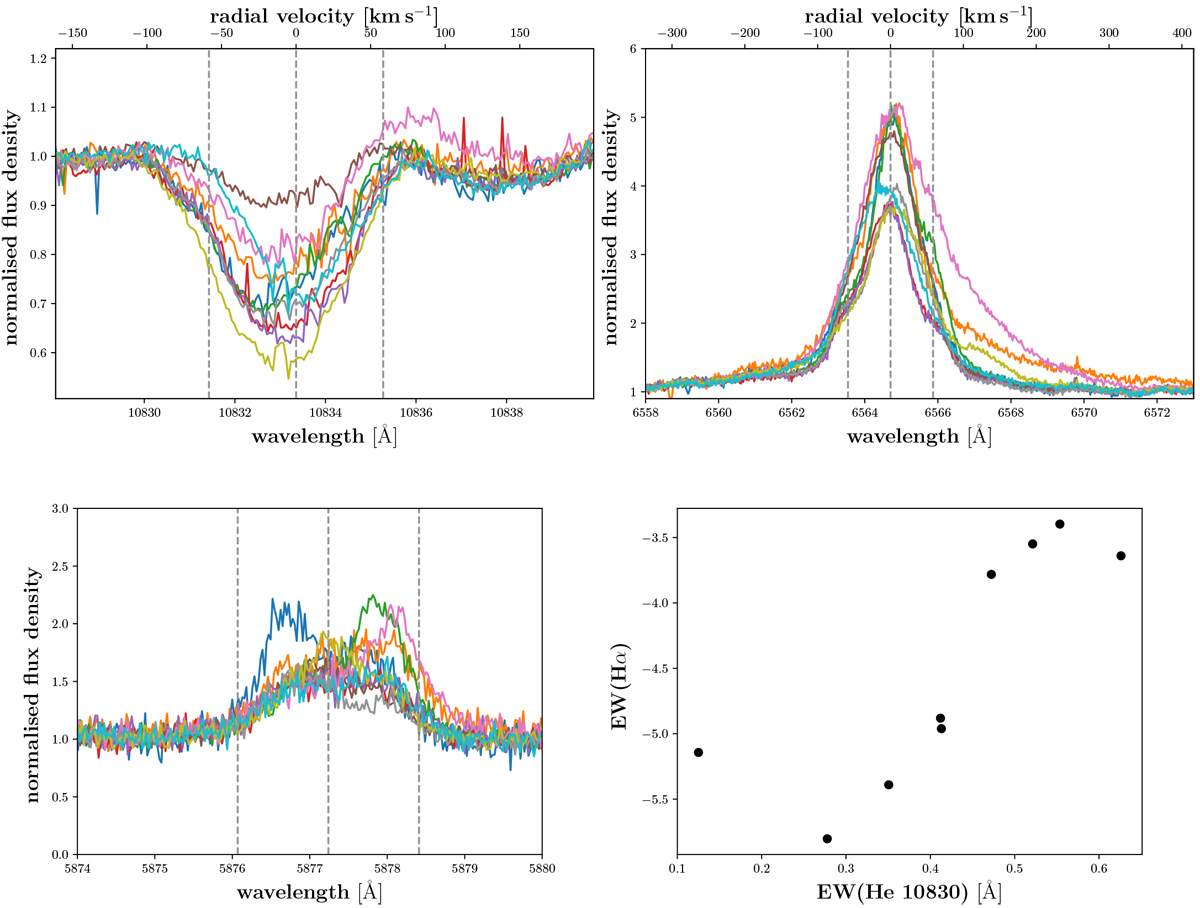
Individual spectra for different chromospheric indicator lines for the M4.0 star Barta 161 12. Top left: He I IR line. Top right: Hα line. Bottom left: He I D3 line. Bottom right: correlation between pEW(He I) and pEW(Hα).
Current usage metrics show cumulative count of Article Views (full-text article views including HTML views, PDF and ePub downloads, according to the available data) and Abstracts Views on Vision4Press platform.
Data correspond to usage on the plateform after 2015. The current usage metrics is available 48-96 hours after online publication and is updated daily on week days.
Initial download of the metrics may take a while.