Fig. 11
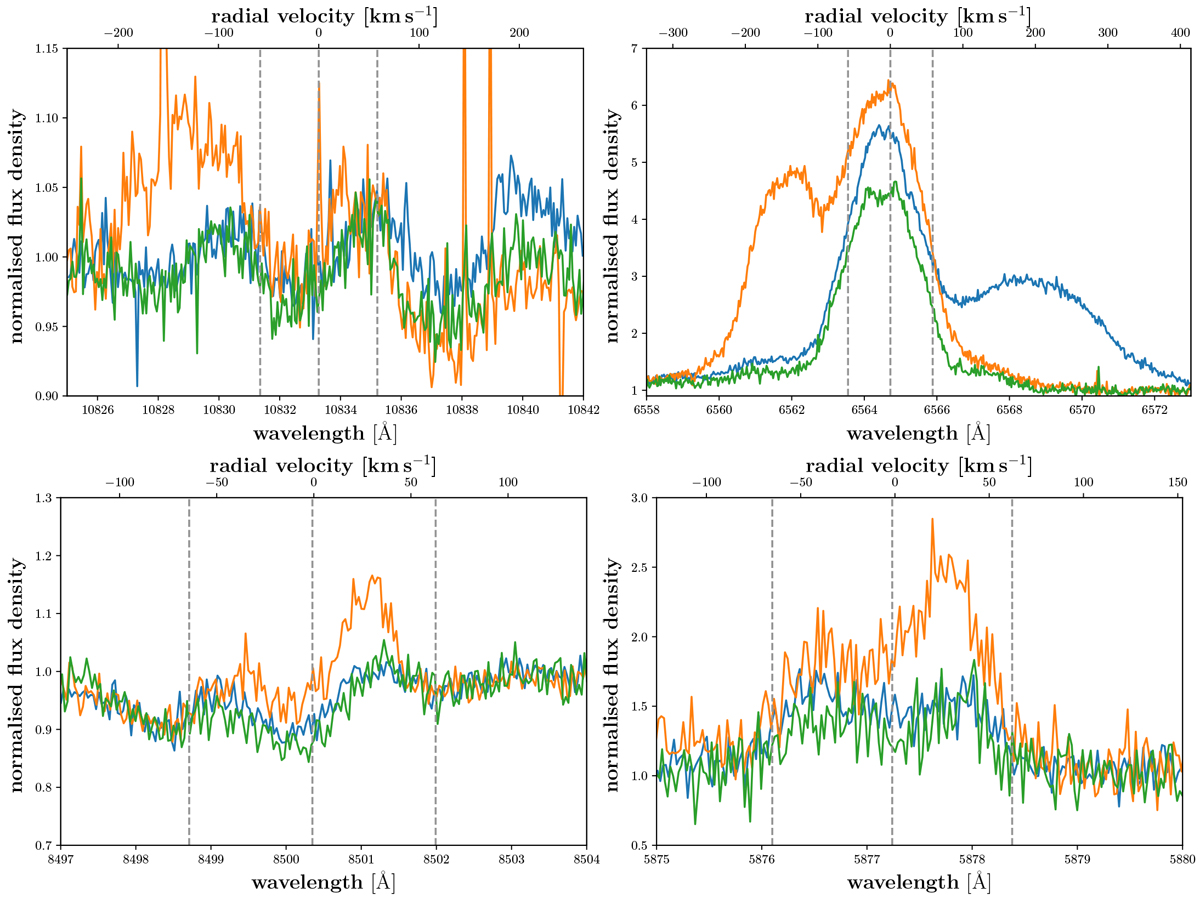
Three of 22 available spectra for different chromospheric indicator lines for LP 205-044. Top left: He I IR line. Top right: Hα line. Bottom left: He I D3 line. Bottom right: bluest Ca II IRT line. The dashed vertical lines indicate the central wavelength of the respective chromospheric lines and the wavelengths corresponding to the maximum rotational velocity of v sin i = 58.4 km s−1. The quiescent activity level is represented by the green spectra. The blue spectrum no. 1 is taken at JD 7823.44 and the orange spectrum no. 2 is taken at JD 8057.63 d.
Current usage metrics show cumulative count of Article Views (full-text article views including HTML views, PDF and ePub downloads, according to the available data) and Abstracts Views on Vision4Press platform.
Data correspond to usage on the plateform after 2015. The current usage metrics is available 48-96 hours after online publication and is updated daily on week days.
Initial download of the metrics may take a while.