Fig. 1
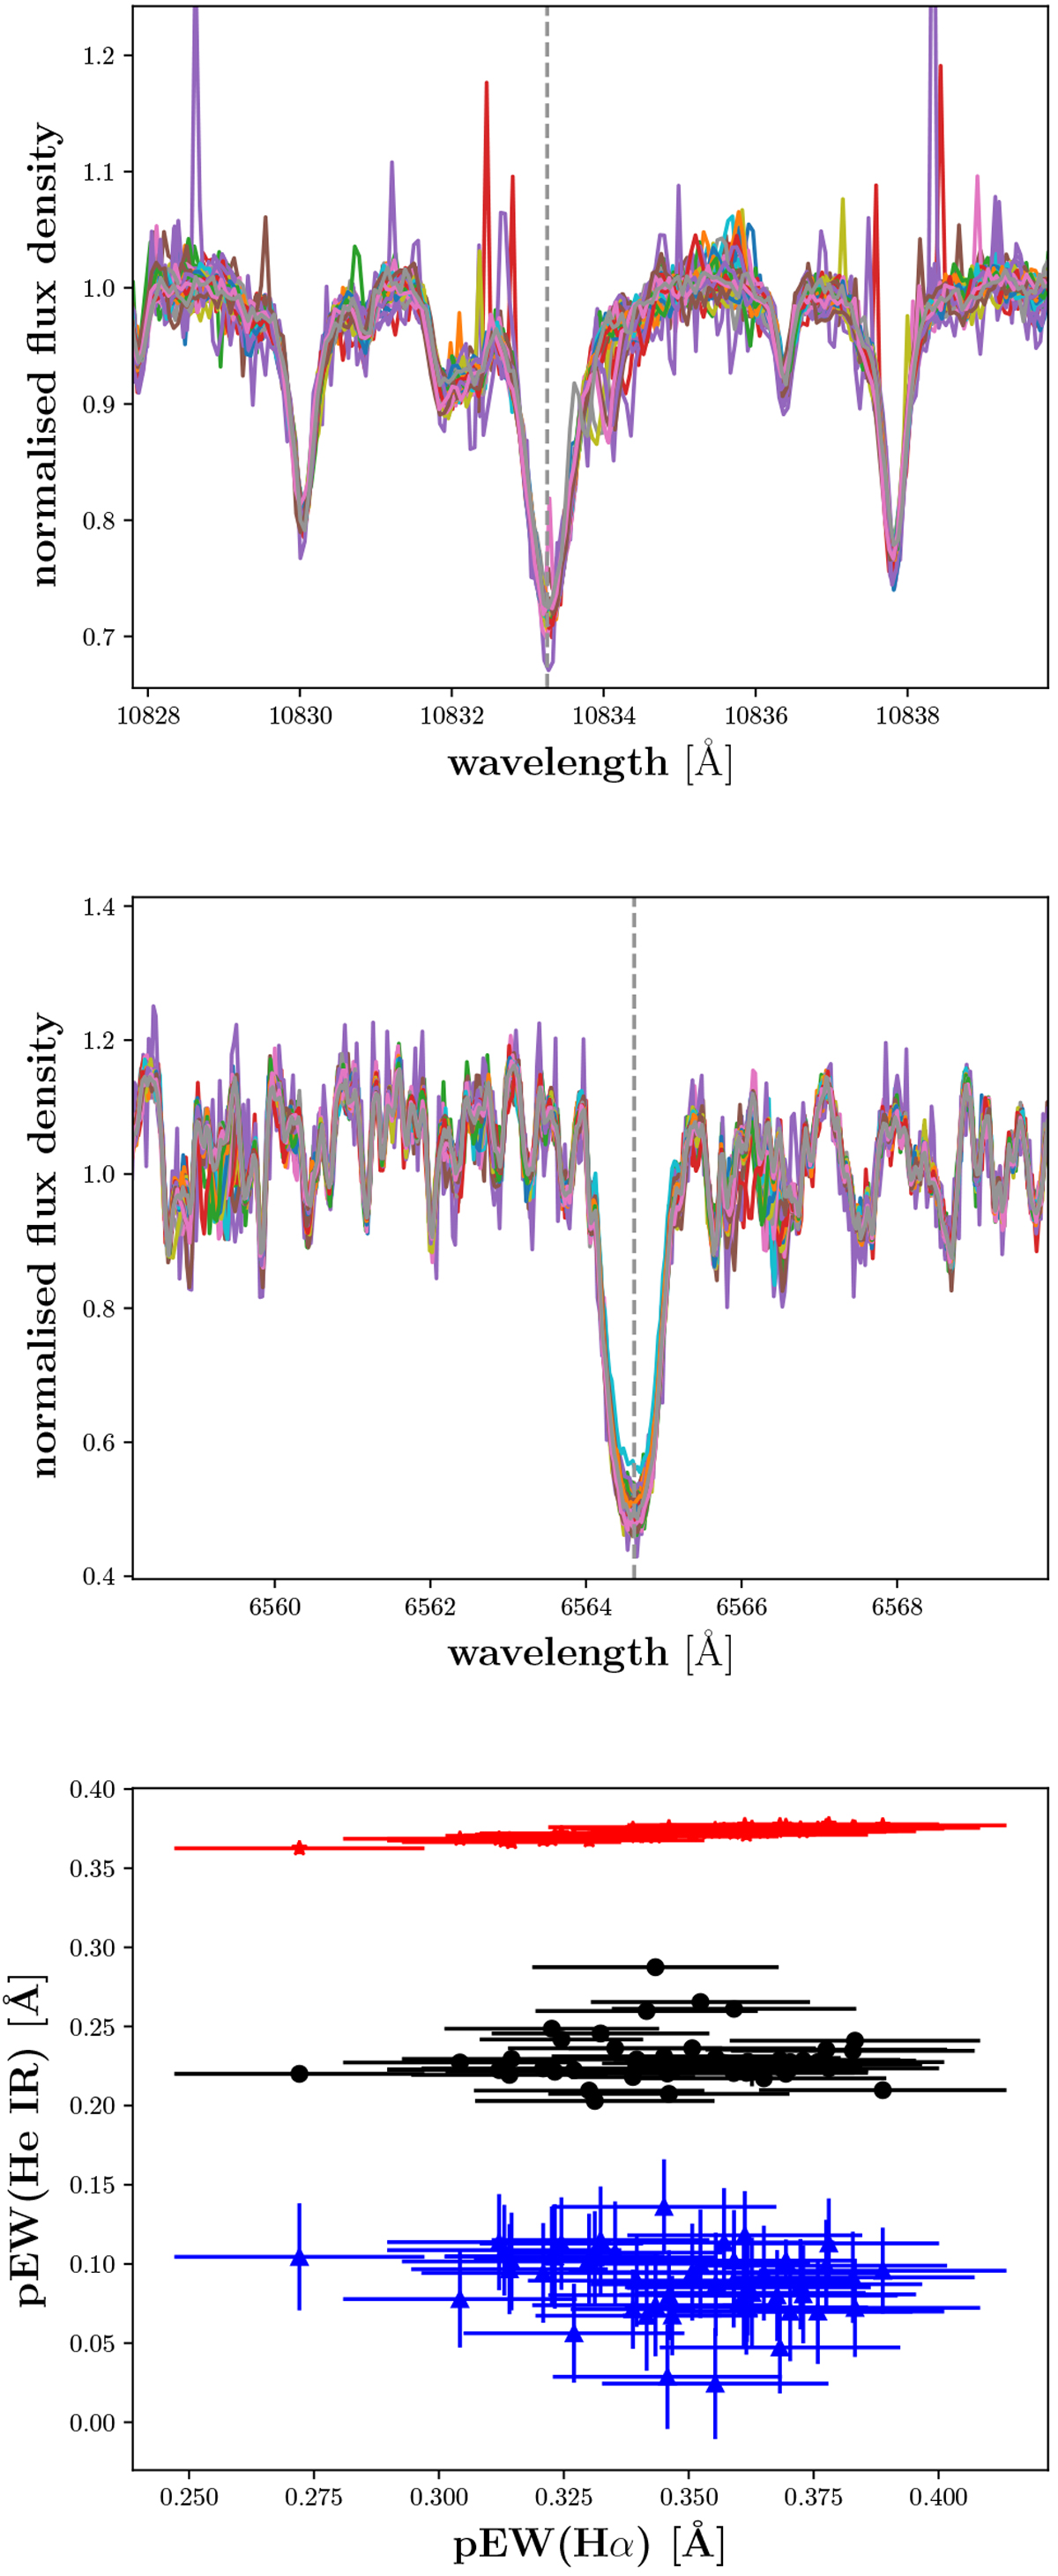
All available spectra of the M1.5 V star GJ 2. Top: region around the He I IR line. Some artefacts of airglow and cosmics manifest themselves as emission spikes. Middle: region around Hα. Minor telluric contamination at about 6559–6560 and 6566–6567 Å is evident. The dashed vertical lines indicate the central wavelength of the He I IR and Hα lines, respectively. Bottom: correlation for different chromospheric lines to pEW(Hα). Black denotes pEW(He I IR), blue denotes pEW(He I D3) scaled by −4, and red denotes pEW(Ca II IRT1) scaled by 0.5.
Current usage metrics show cumulative count of Article Views (full-text article views including HTML views, PDF and ePub downloads, according to the available data) and Abstracts Views on Vision4Press platform.
Data correspond to usage on the plateform after 2015. The current usage metrics is available 48-96 hours after online publication and is updated daily on week days.
Initial download of the metrics may take a while.