Free Access
Fig. A.3
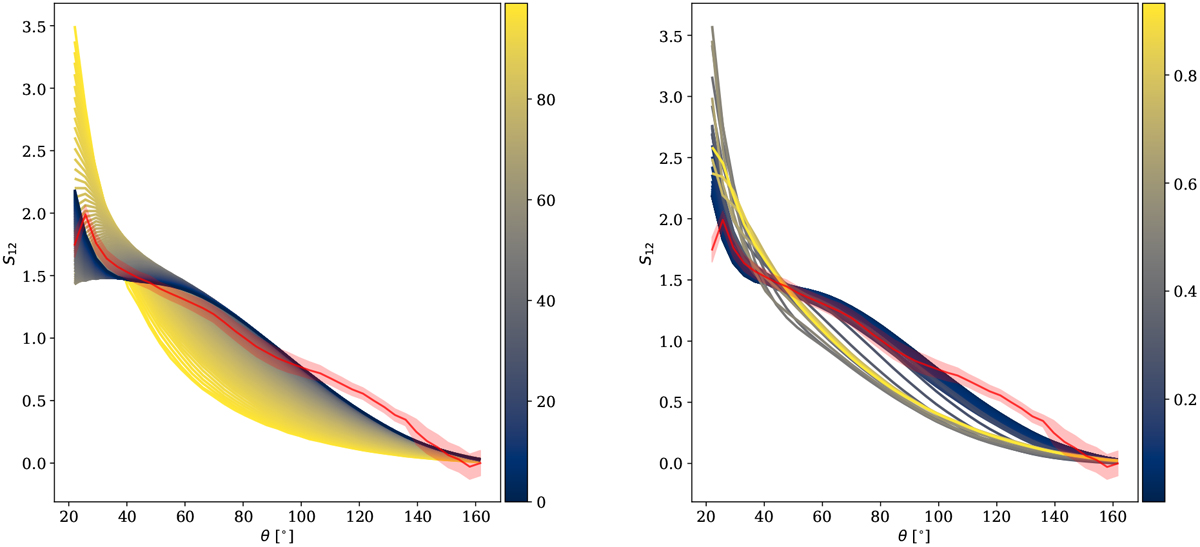
Different phases functions compared to the phase function estimated for the south side of the disc, for different values of the porosity (left) and minimum grain size (right). The color bars are in units of percent and μm (left and right, respectively).
Current usage metrics show cumulative count of Article Views (full-text article views including HTML views, PDF and ePub downloads, according to the available data) and Abstracts Views on Vision4Press platform.
Data correspond to usage on the plateform after 2015. The current usage metrics is available 48-96 hours after online publication and is updated daily on week days.
Initial download of the metrics may take a while.